
General Accident Insurance Company Limited (GENAC)
For the six months ended June 30, 2017:
- GENAC reported net premium written of $673.34 million, 15% more than the $585.29 million reported for 2016. This was as a result of a 4% increase in gross premium written to $4.55 billion (2016: $4.37 billion), while reinsurance ceded increased by 3% from $3.73 billion last year to $3.82 billion. Excess of loss reinsurance grew by 4% to $53.57 million from $51.51 million.
- Net changes in unearned premiums totaled $55.57 million, 26% more than the $44.23 million recorded last year. Consequently, net premiums earned grew by 14% to a total of $617.78 million compared to $541.06 million for the same period last year.
- Commission income increased by 5%, year over year, from $239.37 million in 2016 to $250.97 million while commission expenses increased by 19% from $142.57 million in 2016 to $169.12 million.
- Claims expenses saw an increase of 14%, closing the period at $539.04 million (2016: $474.49 million) while management expenses rose by 26% to total $272.23 million compared to the 2016 total of $216.19 million. Net change in commission totaled $43.70 million, 347% higher than $9.77 million reported last year.
- Underwriting loss for the period totaled $67.95 million, compared to a loss of $43.05 million in 2016.
- Investment Income closed at $90.45 million, a 1% decline when compared with last year’s $91.03 million, while other income totaled $3.42 million, a significant decline when compared to the $34.23 million reported for the same period last year. Other operating expenses grew by 2% to $14.33 million relative to $13.99 million in 2016.
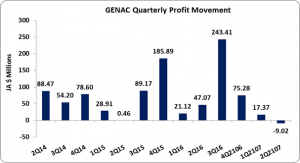
- Profit before taxation amounted to $11.58 million (2016: $68.22 million). Net Profit totaled $8.34 million for the period, a decrease of 88% compared to the $68.19 million reported last year, following tax charges of $3.2 million (2016: $30,000). Net loss for the second quarter amounted to $9.02 million relative to profit of $47.07 million in 2016.
- As such, Earning per share for the six months amounted to $0.008 (2016: $0.066) while loss per share for the quarter amounted to $0.009 compared to $0.046 in 2016. The twelve-month trailing EPS amounted to $0.317. The number of shares used in our calculations amounted to 1,031,250,000 units.
Balance Sheet at a glance:-
- Total Assets increased by 12% to $5.62 billion as at June 30, 2017 from $5.03 billion a year ago.
- Shareholder’s Equity as at June 30, 2017 stood at $2.05 billion (2016: $1.89 billion) resulting in book value per share of $1.99 (2016: $1.84).
Disclaimer:
Analyst Certification -This research report is for information purposes only and should not be construed as a recommendation. Each research analyst (s) also certify that no part of their compensation was, is, or will be, directly or indirectly, related to the specific recommendation (s) or view (s) expressed by that research analyst in this research report.
Company Disclosure -The information contained herein has been obtained from sources believed to be reliable, however its accuracy and completeness cannot be guaranteed. You are hereby notified that any disclosure, copying, distribution or taking any action in reliance on the contents of this information is strictly prohibited and may be unlawful. Mayberry may effect transactions or have positions in securities mentioned herein. In addition, employees of Mayberry may have positions and effect transactions in the securities mentioned herein.


