
April 4, 2022
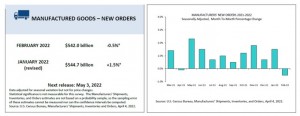
On April 4, 2022, the U.S Census Bureau announced that February new orders for manufactured goods declined $2.7 billion or 0.5% to $542.0 billion. This follows a 1.5% gain in January, while, shipments grew by $3.1 billion or 0.6% to $541.0 billion, up twenty-one of the prior twenty-two months. This follows a 1.4% gain in January. Unfilled orders grew $5.4 billion or 0.4 percent to $1,288.5 billion for the thirteenth straight month. This follows a 0.9% gain in January. The ratio of unfulfilled orders to shipments was 6.74 in February, up from 6.72 in January. Inventories climbed by $5.0 billion or 0.6% to $785.2 billion during the previous twenty-one months. This follows a 0.8% gain in January. The inventories-to-shipments ratio was stable at 1.45 in January 2022.
New Orders
New orders for manufactured durable goods increased four consecutive months, however declined by $5.8 billion or 2.1% to $271.7 billion in February 2022, up from the previously reported 2.2% decline. This follows a 1.5% gain in January 2022. Transportation equipment fell $4.6 billion or 5.3% to $82.8 billion, following three consecutive monthly growth. Nonetheless, new orders for manufactured nondurable items climbed by $3.1 billion, or 1.2% to $270.3 billion.
Shipments
Shipments of manufactured durable goods gained less than $0.1 billion to $270.7 billion in February, up from the previously stated nearly unchanged fall. This follows a 1.2% gain in January. Computers and electronic devices, which have increased in seven of the past eight months, pushed the increase to $30.3 billion, up $0.4 billion or 1.2%. Shipments of manufactured nondurable products grew $3.1 billion or 1.2% to $270.3 billion, up twenty-one of the prior twenty-two months. This follows a 1.5% rise in January. Petroleum and coal products, which have increased in nine of the past ten months, drove the rise, which totaled $61.5 billion, or $2.4 billion or 4.1%.
Unfilled Orders
Unfilled orders for manufactured durable goods climbed $5.4 billion or 0.4% to $1,288.5 billion in February, unchanged from the previously announced rise. This follows a 0.9% gain in January. Transportation equipment increased by $5.0 billion or 0.6% to $853.4 billion in twelve of the past thirteen months.
Inventories
In February, inventtories of manufactured durable goods grew $2.3 billion or 0.5% to $479.1 billion, above the previously reported 0.4% gain. This follows a 0.5% gain in January. Machinery, which has increased for sixteen consecutive months, led the rise, which totaled $80.5 billion, or $0.8 billion or 1.0%. Inventories of manufactured nondurable products climbed by $2.8 billion or 0.9 % to $306.2 billion, up sixteen of the prior seventeen months. This follows a 1.2 percent gain in January. Petroleum and coal products, which have increased in nine of the past ten months, accounted for the majority of the rise, which totaled $1.7 billion or 3.7% to $48.1 billion. February materials and supplies increased 1.0% in durable goods and 0.1% in nondurable goods. Work in process increased 0.3% in durable goods and 2.1% in nondurable goods. Finished goods increased 0.1% in durable goods and 1.0% in nondurable goods.
Disclaimer:
Analyst Certification -The views expressed in this research report accurately reflect the personal views of Mayberry Investments Limited Research Department about those issuer (s) or securities as at the date of this report. Each research analyst (s) also certify that no part of their compensation was, is, or will be, directly or indirectly, related to the specific recommendation (s) or view (s) expressed by that research analyst in this research report.
Company Disclosure -The information contained herein has been obtained from sources believed to be reliable, however its accuracy and completeness cannot be guaranteed. You are hereby notified that any disclosure, copying, distribution or taking any action in reliance on the contents of this information is strictly prohibited and may be unlawful. Mayberry may affect transactions or have positions in securities mentioned herein. In addition, employees of Mayberry may have positions and effect transactions in the securities mentioned herein.