
August 15, 2024
Access Financial Limited (AFS) for the first quarter ended June 30, 2024, reported $592.57 million in total interest income, a 19% increase relative to the $498.01 million recorded in 2023. Of this, Interest Income from Loans amounted to $590.40 million (2023: $497.28 million), while Interest Income from Securities totalled $2.17 million (2023: $727,000).
Interest Expense for the period totaled $98.05 million, a 19% increase compared to the $82.60 million booked in 2023. This resulted in AFS recording a Net Interest Income of $494.52 million for the period, a 19% increase from the $415.41 million booked in 2023.
Net Fee & Commission Income for the six months decreased by 22% to $73.64 million from the $94.45 million booked in 2023.
Net Trading Income increased by 11% to $568.15 million (2023: $509.86 million).
AFS reported income from money services of $4,000 (2023: $31,0000) and other income of $47.33 million (2023: $50.05 million). Foreign Exchange losses of $1.86 million was reported this period relative to foreign exchange gains of $3.22 million booked same time last year. As such, Other Operating Income for the period decreased 15% totaling $45.48 million compared to $53.57 million recorded in 2023.
AFS reported Total Operating Expenses for the period of $450.28 million (2023: $420.64 million). Of this:
Staff Cost totaled $162.25 million (2023: $166.73 million).
Allowance for Credit Losses amounted to $137.42 million (2023: $85.40 million).
Depreciation & Amortization amounted to $22.58 million (2023: $29.04 million).
Other Operating Expenses booked for the period totaled $106.44 million (2023: $113.87 million).
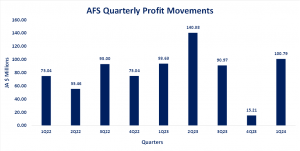
Consequently, Profit before taxation increased 14% to $163.34 million for the period relative to $142.79 million recorded in 2023.
AFS paid taxes amounting to $62.56 million (2023: $49.16 million), AFS booked a Profit for the period of $100.79 million, an 8% increase relative to the $93.63 million recorded for the comparable period in 2023.
Total Comprehensive Income decreased 4% to $110.67 million from $115.14 million booked the same time last year.
Consequently, Earnings Per Share for the six months amounted to $0.37 (2023: EPS: $0.34), The twelve-month trailing EPS was $1.27, and the number of shares used in these calculations was 274,509,840.
Notably, AFS’s stock price closed the trading period on August 14, 2024, at a price of $18.96 with a corresponding P/E ratio of 14.98x.
Balance Sheet Highlights
The company’s assets totalled $7.51 billion (2023: $6.69 billion). The growth in total assets was primarily due to ‘Loans and advances’ increasing by $679.51 million or 13% to $5.82 billion in the period (2023: $5.14 billion).
Shareholder’s equity was $3.03 billion (2023: $2.77 billion), representing a book value per share of $11.05 (2023: $10.10).
Disclaimer:
Analyst Certification -The views expressed in this research report accurately reflect the personal views of Mayberry Investments Limited Research Department about those issuer (s) or securities as at the date of this report. Each research analyst (s) also certify that no part of their compensation was, is, or will be, directly or indirectly, related to the specific recommendation(s) or view (s) expressed by that research analyst in this research report.
Company Disclosure -The information contained herein has been obtained from sources believed to be reliable, however its accuracy and completeness cannot be guaranteed. You are hereby notified that any disclosure, copying, distribution or taking any action in reliance on the contents of this information is strictly prohibited and may be unlawful. Mayberry may effect transactions or have positions in securities mentioned herein. In addition, employees of Mayberry may have positions and effect transactions in the securities mentioned herein.

