
September 10, 2025
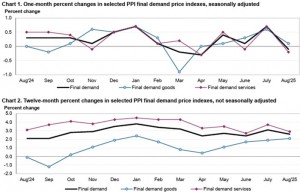
According to the U.S. Bureau of Labor Statistics, the Producer Price Index (PPI) for final demand in the U.S. edged down 0.1 percent in August on a seasonally adjusted basis. This follows a 0.7 percent increase in July and a 0.1 percent rise in June. On an unadjusted basis, the index for final demand advanced 2.6 percent over the 12 months ended August 2025.
In August, a 0.2 percent decline in prices for final demand services accounted for the overall decrease, while prices for final demand goods inched up 0.1 percent.
Excluding foods, energy, and trade services, the index for final demand rose 0.3 percent in August, marking the fourth consecutive monthly increase. Over the past 12 months, this index has advanced 2.8 percent, the largest 12-month increase since March 2025.
Final demand goods
The index for final demand goods rose 0.1 percent in August, continuing a four-month streak of increases. Leading the gain was a 0.3 percent rise in prices for goods excluding foods and energy. Food prices edged up 0.1 percent, while energy prices declined 0.4 percent.
Notable contributors to the increase included a 2.3 percent rise in prices for tobacco products, along with gains in beef and veal, processed poultry, printed circuit assemblies and related electronics, and electric power. These were partially offset by a 1.8 percent decline in utility natural gas prices, as well as decreases in prices for fresh and dry vegetables, chicken eggs, and copper base scrap.
Final demand services
The index for final demand services fell 0.2 percent in August, the largest monthly decline since April. This was primarily driven by a 1.7 percent drop in margins for final demand trade services. Prices for services excluding trade, transportation, and warehousing rose 0.3 percent, while transportation and warehousing services increased 0.9 percent.
Key contributors to the decline included a 3.9 percent drop in margins for machinery and vehicle wholesaling, along with decreases in professional and commercial equipment wholesaling, chemicals and allied products wholesaling, furniture retailing, food and alcohol retailing, and data processing services. Offsetting these declines were gains in portfolio management (up 2.0 percent), truck transportation of freight, and apparel wholesaling.
Disclaimer:
Analyst Certification – The views expressed in this research report accurately reflect the personal views of Mayberry Investments Limited Research Department about those issuer (s) or securities as at the date of this report. Each research analyst (s) also certify that no part of their compensation was, is, or will be, directly or indirectly, related to the specific recommendation(s) or view (s) expressed by that research analyst in this research report.
Company Disclosure – The information contained herein has been obtained from sources believed to be reliable, however its accuracy and completeness cannot be guaranteed. You are hereby notified that any disclosure, copying, distribution or taking any action in reliance on the contents of this information is strictly prohibited and may be unlawful. Mayberry may effect transactions or have positions in securities mentioned herein. In addition, employees of Mayberry may have positions and effect transactions in the securities mentioned herein.

