
November 25, 2025
Elite Diagnostic Limited (ELITE)
Unaudited financials for the first quarter ended September 30, 2025:
Elite Diagnostic Limited (ELITE) reported a 7% increase in revenue, totaling $217.30 million for the first quarter ended September 30, 2025, compared to $202.87 million in the corresponding three months last year.
Year to date, direct cost amounted to $51.34 million (2024: $60.01 million), representing a 14% decrease year-over-year. Consequently, gross profit increased by 16% to $165.96 million, compared to $142.86 million for the first quarter ended September 30, 2024.
Administrative Expenses decreased by 2%, closing at $100.01 million (2024: $102.44 million), while Depreciation increased by 6%, moving from $41.95 million in 2024 to $44.31 million for the three months. As a result, Operating Profit for the first quarter amounted to $21.64 million, a notable turnaround relative to the loss of $1.52 million reported in 2024.
Foreign Exchange Gain for the three months amounted to $777,000, a 677% increase compared to $100,000 reported in 2024. Finance Cost totaled $10.61 million, a 6% increase from the corresponding period last year (2024: $10.04 million). Additionally, other income amounted to $633, 000 (2024: $17, 000).
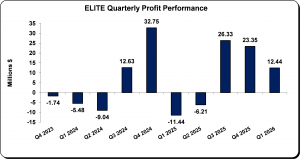
Profit Before Tax for the first quarter ended September 30, 2025, amounted to $12.44 million, a 9% increase relative to $11.44 million reported in 2024.
No tax charge was incurred in the period (2024: nil). Net Profit for the three months amounted to $12.44 million, a 209% increase from the loss of $11.44 million reported in 2024.
Consequently, Earnings Per Share for the three months amounted to $0.035 (2024: LPS: $0.03). The twelve-month trailing EPS was $0.16, and the number of shares used in these calculations was 353,400,000. Notably, ELITE’s stock price closed the trading period on November 24, 2025, at a price of $1.53 with a corresponding P/E ratio of 9.86x.
Balance Sheet Highlights
The company’s assets totaled $1.22 billion (2024: $1.04 billion). The movement in total assets was mainly attributable to 373% increase in ‘Cash and cash equivalents’ amounting to $217.06 million (2024: $45.88 million) which was offset by a $49.71 million decline in ‘Receivables’ amounting to $92.43 million (2024: $142.14 million)
Shareholder’s equity was $555.10 million (2024: $499.54 million), representing a book value per share of $1.57 (2024: $1.41).
Disclaimer:
Analyst Certification -The views expressed in this research report accurately reflect the personal views of Mayberry Investments Limited Research Department about those issuer (s) or securities as at the date of this report. Each research analyst (s) also certify that no part of their compensation was, is, or will be, directly or indirectly, related to the specific recommendation(s) or view (s) expressed by that research analyst in this research report.
Company Disclosure -The information contained herein has been obtained from sources believed to be reliable, however its accuracy and completeness cannot be guaranteed. You are hereby notified that any disclosure, copying, distribution or taking any action in reliance on the contents of this information is strictly prohibited and may be unlawful. Mayberry may effect transactions or have positions in securities mentioned herein. In addition, employees of Mayberry may have positions and effect transactions in the securities mentioned herein.

