
February 11, 2026
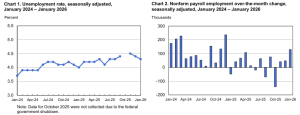
According to the U.S. Bureau of Labor Statistics, total nonfarm payroll employment rose by 130,000 in January, while the unemployment rate remained little changed at 4.3%. Employment increased notably in health care, social assistance, and construction, whereas federal government and financial activities experienced declines. These findings are based on two monthly surveys: the household survey, which measures labour force status including unemployment by demographic characteristics, and the establishment survey, which assesses nonfarm employment, hours, and earnings by industry.
The BLS highlighted that establishment survey data were revised through the annual benchmarking process, which included updates to seasonal adjustment factors and enhancements to the birth–death model incorporating current sample information each month. These revisions help improve the accuracy of industry‑level employment estimates and reflect methodological updates typically implemented at the beginning of each calendar year.
Household Survey Data
In January, the unemployment rate remained at 4.3%, with 7.4 million individuals unemployed, showing little variation from the previous month. Both figures were still higher than those recorded a year earlier, when unemployment stood at 4.0% and 6.9 million people were without work. The jobless rates across major demographic groups displayed limited change, with adult men at 3.8%, adult women at 4.0%, teenagers at 13.6%, Whites at 3.7%, Blacks at 7.2%, Asians at 4.1%, and Hispanics at 4.7%.
The number of people unemployed for 27 weeks or more held steady at 1.8 million in January, though this total is 386,000 higher than the level seen a year earlier. Long term unemployed individuals accounted for 25.0% of all people jobless during the month, underscoring a persistent challenge despite generally stable conditions elsewhere in the labour market.
Labour force participation showed little movement, with the rate holding at 62.5%, while the employment population ratio remained stable at 59.8%. These measures have seen minimal fluctuation over the past year, indicating an overall steadiness in broader labour market engagement despite shifts within specific subgroups.
Part time employment for economic reasons declined to 4.9 million in January, though it remains elevated compared with a year earlier. Meanwhile, the number of people not in the labour force who wanted a job fell to 5.8 million, even as the number of those marginally attached to the labour force (1.7 million) and discouraged workers (475,000) showed little change.
Establishment Survey Data
Total nonfarm payroll employment increased by 130,000 in January, reflecting modest overall growth. Most of the month’s gains came from health care, social assistance, and construction, while employment in the federal government and financial activities declined. This followed a year in which payroll employment showed only slight movement, averaging an additional 15,000 jobs per month in 2025.
Health care continued to be a major driver of job creation, adding 82,000 positions in January. Growth was widespread across the sector, with ambulatory health care services contributing 50,000 jobs, hospitals adding 18,000, and nursing and residential care facilities increasing by 13,000. This marks an acceleration compared with 2025, when monthly health care job growth averaged 33,000.
Social assistance also saw a solid increase, with employment rising by 42,000 in January. Nearly all this gain came from individual and family services, which expanded by 38,000 jobs. Construction added 33,000 positions during the month as well, driven largely by a 25,000 job increase among non-residential specialty trade contractors, even though overall construction employment had been mostly flat throughout 2025.
Federal government employment continued trending downward, falling by 34,000 in January as workers who had accepted deferred resignations in 2025 left the payrolls. Since peaking in October 2024, federal employment has declined by 327,000, or nearly 11 percent. Financial activities also contracted, losing 22,000 jobs in January and marking a total decline of 49,000 since the industry’s recent peak in May 2025, with insurance carriers accounting for 11,000 of the monthly losses.
Other major industries—including mining, manufacturing, wholesale and retail trade, transportation and warehousing, information, professional and business services, leisure and hospitality, and other services—showed little change during the month. Average hourly earnings for all private nonfarm employees rose by 15 cents to $37.17, a 0.4 percent increase, bringing the 12 month gain to 3.7 percent. The average workweek edged up to 34.3 hours, with similar small increases for manufacturing and for production and nonsupervisory workers. Meanwhile, revisions to earlier estimates lowered November’s job gain to 41,000 and December’s to 48,000, leaving employment levels for the two months a combined 17,000 lower than initially reported.
Disclaimer:
Analyst Certification – The views expressed in this research report accurately reflect the personal views of Mayberry Investments Limited Research Department about those issuer (s) or securities as at the date of this report. Each research analyst (s) also certify that no part of their compensation was, is, or will be, directly or indirectly, related to the specific recommendation(s) or view (s) expressed by that research analyst in this research report.
Company Disclosure – The information contained herein has been obtained from sources believed to be reliable, however its accuracy and completeness cannot be guaranteed. You are hereby notified that any disclosure, copying, distribution or taking any action in reliance on the contents of this information is strictly prohibited and may be unlawful. Mayberry may effect transactions or have positions in securities mentioned herein. In addition, employees of Mayberry may have positions and effect transactions in the securities mentioned herein.


