
March 2, 2026
Sagicor Real Estate X Fund LTD (XFUND)
Unaudited financials for the twelve months ended December 31, 2025:
Sagicor Real Estate X Fund LTD (XFUND) for the twelve months ended December 31, 2025, reported a 9% increase in Total Revenue totaling $8.48 billion compared to $7.80 billion in the corresponding period last year. Total Revenue for the fourth quarter increased 5% to $1.72 billion, compared with $1.64 billion in the comparable quarter of 2024.
Net capital gains on financial assets and liabilities amounted to $337.32 million (2024: loss of $89.33 million), representing an increase of 478% year over year. Consequently, hotel revenue increased by 4% to $7.64 billion compared to $7.33 billion for the twelve months ended December 31, 2024. The company booked hotel revenue of $1.68 billion in the fourth quarter, down from $1.72 billion in the comparable quarter of 2024. In addition, other operating expenses for the twelve months ended December 31, 2025, amounted to $516.40 million relative to $469.46 million reported in 2024.
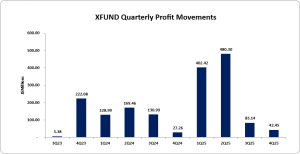
Profit before taxation for the twelve months closed at $1.36 billion (2024: $752.15 million), driven by improved revenue streams and cost management, highlighting operational efficiencies that positively impacted overall profitability.
Taxation for the twelve months ended December 31, 2025, increased by 19% to $352.73 million, reflecting adjustments in tax strategies and their impact on net profit, which rose by 121% to $1.01 billion (2024: $456.70 million), ensuring stakeholders understand the tax influence on overall profitability. For the fourth quarter, Net Profit attributable to shareholders was $42.45 million (2024: $27.26 million).
For the twelve months, Earnings Per Share increased to $0.45 from $0.20 in 2024, demonstrating consistent growth and positive momentum for shareholders. The quarter’s EPS was $0.02, up from $0.01, reflecting ongoing profitability improvements. Notably, XFUND’s stock price closed the trading period on March 02, 2026, at $8.21, with a corresponding P/E ratio of 18.26x.
Balance Sheet Highlights
The company’s assets totalled $30.07 billion (2024: $32.21 billion). The total decrease in the company’s asset base is driven by 47% YoY decline in Financial investments under non current assets ending the year at $1.74 billion (2024: $3.29 billion), a 92% YoY decline in Cash resources ending the year at $195.99 million (2024: $2.38 billion), and a 22% YoY in Financial Investments under current assets ending the year at $2.86 billion (2024: $3.67 billion).
Shareholders’ equity was $23.60 billion (2024: $22.07 billion), representing a book value per share of $10.52 (2024: $9.84).
Disclaimer:
Analyst Certification -The views expressed in this research report accurately reflect the personal views of Mayberry Investments Limited Research Department about those issuer (s) or securities as at the date of this report. Each research analyst (s) also certify that no part of their compensation was, is, or will be, directly or indirectly, related to the specific recommendation (s) or view (s) expressed by that research analyst in this research report.
Company Disclosure -The information contained herein has been obtained from sources believed to be reliable, however its accuracy and completeness cannot be guaranteed. You are hereby notified that any disclosure, copying, distribution or taking any action in reliance on the contents of this information is strictly prohibited and may be unlawful. Mayberry may effect transactions or have positions in securities mentioned herein. In addition, employees of Mayberry may have positions and effect transactions in the securities mentioned herein.


