
June 5, 2026
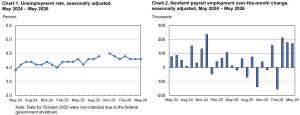
According to the U.S. Bureau of Labor Statistics, total nonfarm payroll employment increased by 172,000 in May, while the unemployment rate remained unchanged at 4.3%. Job gains were concentrated in leisure and hospitality, local government, and health care, while financial activities continued to shed workers. These figures are derived from the two monthly BLS surveys: the household survey, which assesses labour force status and unemployment by demographic characteristics, and the establishment survey, which measures nonfarm employment, hours, and earnings across industries.
The BLS also noted upward revisions to prior months, with combined March and April employment revised 93,000 higher than previously reported, reflecting additional reports received from businesses and government agencies and the recalculation of seasonal factors.
Household Survey Data
In May, the unemployment rate held at 4.3%, with approximately 7.3 million individuals unemployed, showing little variation from the previous month. The rate has remained within a narrow range of 4.3% to 4.5% since July 2025, suggesting a broadly stable labour market. Unemployment rates across major demographic groups were similarly little changed, with adult men at 4.0%, adult women at 3.8%, teenagers at 14.7%, Whites at 3.8%, Blacks at 6.6%, Asians at 3.8%, and Hispanics at 5.0%.
The number of people unemployed for 27 weeks or more stood at 2.0 million in May, little changed over the month but up by 524,000 over the year. Long-term unemployed individuals represented 27.5% of all unemployed persons, underscoring persistent challenges for those facing extended joblessness even as near-term labour market conditions remain relatively steady.
Broader labour force engagement also remained stable. The labour force participation rate held at 61.8%, and the employment-population ratio was little changed at 59.2%, with both measures showing minimal year-on-year movement after accounting for annual population control adjustments. The number of people employed part time for economic reasons, at 4.8 million, was also essentially unchanged, as was the count of discouraged workers at 486,000.
Establishment Survey Data
Nonfarm payroll employment rose by 172,000 in May, broadly consistent with the upwardly revised gain of 179,000 in April. Leisure and hospitality led all sectors with an addition of 70,000 jobs — well above its average monthly gain of 14,000 over the prior twelve months — driven largely by food services and drinking places, which added 48,000 positions. Local government employment rose by 55,000, with the bulk of gains coming outside of education (+44,000). Health care added 35,000 jobs, in line with its recent trend of approximately 38,000 per month, with ambulatory health care services and hospitals accounting for the majority of those gains.
Social assistance continued to trend upward (+12,000), primarily in individual and family services, while mining, quarrying, and oil and gas extraction added 5,000 jobs, extending recent modest gains.
On the downside, financial activities shed 22,000 jobs in May and is now down 107,000 from its peak in May 2025, with losses concentrated in insurance carriers and related activities and commercial banking. Transportation and warehousing was essentially flat overall, though air transportation lost 9,000 jobs largely due to a business closure, and the sector remains 92,000 below its February 2025 peak. Most other major industries — including construction, manufacturing, retail trade, information, and professional and business services — showed little net change over the month.
Wage growth continued at a measured pace, with average hourly earnings rising 0.3% to $37.53, and 3.4% higher than a year earlier. Production and nonsupervisory workers saw a slightly smaller monthly increase of 0.2%. The average workweek was unchanged at 34.3 hours across private nonfarm payrolls, with manufacturing hours also holding steady.
Disclaimer:
Analyst Certification – The views expressed in this research report accurately reflect the personal views of Mayberry Investments Limited Research Department about those issuer (s) or securities as at the date of this report. Each research analyst (s) also certify that no part of their compensation was, is, or will be, directly or indirectly, related to the specific recommendation(s) or view (s) expressed by that research analyst in this research report.
Company Disclosure – The information contained herein has been obtained from sources believed to be reliable, however its accuracy and completeness cannot be guaranteed. You are hereby notified that any disclosure, copying, distribution or taking any action in reliance on the contents of this information is strictly prohibited and may be unlawful. Mayberry may effect transactions or have positions in securities mentioned herein. In addition, employees of Mayberry may have positions and effect transactions in the securities mentioned herein.


