

August 17, 2026
Sagicor Select Funds Limited Manufacturing & Distribution (SELECTMD)
Unaudited financials for the six months ended June 30, 2026:
Sagicor Select Funds Limited Manufacturing & Distribution (SELECTMD) for the six months ended June 30, 2026, reported a 49% increase in Interest Income totaling $10.80 million compared to $7.24 million in the corresponding period last year. Interest Income for the second quarter had a 106% increase to close at $6.25 million compared to $3.04 million for the comparable quarter of 2025.
Dividend Income amounted to $71.82 million (2025: $68.62 million), representing a 5% year-over-year increase. Consequently, net investment income increased to $432.87 million compared to a loss of $64.67 million for the six months ending June 30, 2025. The company reported net investment income of $274.05 million for the second quarter, compared to a loss of $90.67 million for the same quarter of 2025.
Net changes in fair value on financial assets at fair value through profit or loss reflected a gain of $350.25 million (2025: loss of $140.53 million), the primary driver of the turnaround.
Administration expenses for the six months ended June 30, 2026, amounted to $16.80 million, a 2% increase relative to $16.40 million reported in 2025. Administration expenses for the second quarter amounted to $9.40 million (2025: $9.09 million).
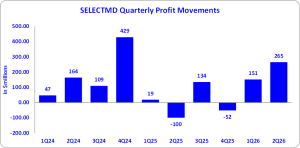
Total expenses for the six months ended June 30, 2026, had a 2% increase to reach $16.80 million (2025: $16.40 million). Net income for the six months amounted to $416.06 million, a turnaround from a loss of $81.06 million reported in 2025. For the second quarter, Net income was $264.65 million (2025: loss of $99.75 million).
Consequently, Earnings Per Share for the six months amounted to $0.11 (2025: LPS: $0.02), while Earnings Per Share for the quarter totaled $0.07 (2025: LPS: $0.03). The twelve-month trailing EPS was $0.13, and the number of shares used in these calculations was 3,816,612,000.
Notably, SELECTMD’s stock price closed the trading period on August 14, 2026, at a price of $0.96 with a corresponding P/E ratio of 7.35x.
Balance Sheet Highlights
The company’s assets totaled $5.27 billion (2025: $4.77 billion). The increase in the company’s total asset base is driven by a 41% YoY increase in “Cash and Cash Equivalents” ending the quarter at $477.46 million (2025: $338.30 million), an 8% YoY increase in “Financial Assets at FVTPL” ending the quarter at $4.78 billion (2025: $4.43 billion) and a 48% YoY increase in “Receivables” ending the quarter at $7.18 million (2025: $4.86 million).
Shareholder’s equity was $5.24 billion (2025: $4.75 billion), representing a book value per share of $1.37 (2025: $1.24).
Disclaimer:
Analyst Certification -The views expressed in this research report accurately reflect the personal views of Mayberry Investments Limited Research Department about those issuer (s) or securities as at the date of this report. Each research analyst (s) also certify that no part of their compensation was, is, or will be, directly or indirectly, related to the specific recommendation(s) or view (s) expressed by that research analyst in this research report.
Company Disclosure -The information contained herein has been obtained from sources believed to be reliable, however its accuracy and completeness cannot be guaranteed. You are hereby notified that any disclosure, copying, distribution or taking any action in reliance on the contents of this information is strictly prohibited and may be unlawful. Mayberry may affect transactions or have positions in securities mentioned herein. In addition, employees of Mayberry may have positions and effect transactions in the securities mentioned herein.