
November 13, 2026
NCB Financial Group Limited (NCBFG)
Unaudited Financial Results — Year Ended September 30, 2026
NCB Financial Group Limited (NCBFG), for the year ended September 30, 2026, reported a 2% increase in interest income totalling $127.54 billion compared to $125.31 billion in the corresponding period last year. Interest income for the fourth quarter increased by 3% to close at $32.50 billion compared to $31.68 billion for the comparable quarter of 2025. Prior year figures have been restated to correct reinsurance expenses within the Life, Health and Pension segment and the finance expenses from insurance contracts issued under the Variable Fee Approach.
Interest expense amounted to $43.00 billion (2025: $46.63 billion), a decrease of 8% year over year. As a result, net interest income increased by 7% to $84.54 billion compared to $78.68 billion for the year ended September 30, 2025. The improvement was driven by higher interest income from investment securities and lower funding costs across the Group’s major funding sources. The Group booked net interest income of $22.05 billion for the fourth quarter versus $19.84 billion for the similar quarter of 2025, an 11% increase.
Net fee and commission income decreased by 5% to close at $28.72 billion (2025: $30.34 billion). The decline reflected changes to selected digital loan products, temporary customer relief measures and lower transaction volumes following Hurricane Melissa, and lower credit-related fees from reduced loan originations. Net income from Banking and Investment Activities decreased by 19%, from $142.97 billion in 2025 to $116.13 billion in the period under review. The decline came mainly from the non-recurrence of the $15.12 billion gain on disposal of a subsidiary recognised in the prior year. Gains on foreign currency and investment activities also fell by 97%, or $20.35 billion, to $603.10 million (2025: $20.95 billion), mostly because of unrealised fair value losses on the equity portfolio held within the insurance segment and lower realised investment gains. Credit impairment losses fell 52% to $4.95 billion (2025: $10.30 billion), which partly offset the decline. Management attributed the improvement to better portfolio quality, stronger collections and recoveries, and impairment reversals on investment securities.
Insurance service results for the year amounted to $26.13 billion, a 4% improvement from $25.21 billion in the prior year. Insurance revenue grew 4% to $153.06 billion. Insurance service expenses climbed 40% to $125.93 billion, mainly because of Hurricane Melissa-related claims in the Property and Casualty segment. Reinsurance recoveries substantially offset this increase, and net expenses from reinsurance contracts held fell 97% to $994.59 million (2025: $31.90 billion). Net insurance finance expenses declined by 52% to $12.80 billion (2025: $26.83 billion). The decline mainly reflected the corresponding offset to fair value losses on assets backing unit-linked products, as well as changes in the yield curve.
As a result, net operating income for the year ended September 30, 2026, amounted to $129.46 billion, an 8% decrease relative to $141.35 billion in 2025. Net operating income for the fourth quarter amounted to $33.28 billion (2025: $31.11 billion).
Total operating expenses were $93.41 billion, a 6% decrease from the corresponding period last year (2025: $99.38 billion). The decrease reflected the non-recurrence of elevated operational losses recorded in the prior year and lower insurance-related operating expenses, management fees, and technical consultancy and professional fees.
Operating Profit for the year amounted to $36.04 billion, a 14% decrease relative to $41.97 billion in 2025. Operating Profit for the fourth quarter amounted to $10.65 billion (2025: $5.99 billion).
Profit before Taxation for the year decreased by 13% to $36.96 billion (2025: $42.57 billion).
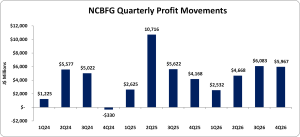
Taxation for the year amounted to $11.06 billion, a 33% increase from the $8.31 billion reported in 2025. As a result, Net Profit decreased by 24% to $25.90 billion (2025: $34.26 billion). Net Profit for the fourth quarter totalled $7.33 billion, up 93% from the $3.81 billion booked in the prior year’s comparable quarter. However, it was 11% or $906 million lower than the third quarter of fiscal 2026, mainly because of unrealised fair value losses on equity investments within the insurance segment.
Net Profit Attributable to Stockholders of the Company for the year totalled $19.25 billion, down 10% from the $21.49 billion reported twelve months prior. For the fourth quarter, Net Profit Attributable to Stockholders amounted to $5.97 billion, compared to $2.53 billion in 2025, and down 2% or $116 million from the June 2026 quarter.
NCBFG highlighted that prior year results included a one-off gain of $15.1 billion from the disposal of the Group’s Netherlands insurance brokerage business. Excluding this gain, net profit for the current year would have increased by $6.8 billion or 35%, and net profit attributable to stockholders of the Company would have improved by 58% or $7.1 billion. On this normalised basis, return on equity and return on assets improved by 2.83 and 0.26 percentage points, respectively, and the cost-to-income ratio improved by 3.29 percentage points. Management also noted that all five banking and investment management segments delivered higher operating profits than in the prior year, despite the disruption caused by Hurricane Melissa in the first quarter.
Earnings Per Share for the year amounted to $7.45 (2025: EPS: $8.31), while Earnings Per Share for the fourth quarter totalled $2.31 (2025: EPS: $0.98). The twelve-month trailing EPS was $7.45, and the number of shares used in these calculations was 2,584,997,347.
Notably, NCBFG’s stock price closed the trading period on November 12, 2026, at a price of $73.77, giving a P/E ratio of 9.91x.
Balance Sheet Highlights
The Group’s assets totalled $2.42 trillion (2025: $2.41 trillion), a 1% or $13.5 billion increase. Investment securities, including pledged assets and reverse repurchase agreements, rose 2% or $29.7 billion to $1.30 trillion. Within this, reverse repurchase agreements grew 94% or $8.9 billion. Reinsurance contract assets grew 43% or $7.9 billion, reflecting ongoing recoveries related to Hurricane Melissa claims. Loans and advances, net of credit impairment losses, declined 2% or $9.9 billion to $608.4 billion as scheduled repayments exceeded new originations. Customer deposits grew 9% or $69.3 billion to $878.7 billion and funded most of the asset growth. Insurance contract liabilities increased 2% to $571.1 billion.
Non-performing loans totalled $23.2 billion at September 30, 2026, down 19% or $5.6 billion from the prior year, and the NPL ratio improved to 3.75% from 4.54%.
Stockholders’ equity attributable to the Company was $211.2 billion (2025: $196.3 billion), an 8% increase driven by higher reserves, the disposal of treasury shares and retained earnings. This represents a book value per share of $81.70 (2025: $75.94), so the stock trades at a price-to-book ratio of 0.90x.
Disclaimer:
Analyst Certification -The views expressed in this research report accurately reflect the personal views of Mayberry Investments Limited Research Department about those issuer (s) or securities as at the date of this report. Each research analyst (s) also certify that no part of their compensation was, is, or will be, directly or indirectly, related to the specific recommendation (s) or view (s) expressed by that research analyst in this research report.
Company Disclosure -The information contained herein has been obtained from sources believed to be reliable, however its accuracy and completeness cannot be guaranteed. You are hereby notified that any disclosure, copying, distribution or taking any action in reliance on the contents of this information is strictly prohibited and may be unlawful. Mayberry may affect transactions or have positions in securities mentioned herein. In addition, employees of Mayberry may have positions and effect transactions in the securities mentioned herein.