
Barita Investments Limited (BIL) for the year ended September 30, 2017 booked a 10% decline in interest income fell by 10% during the twelve-month period, amounting to $1.13 billion relative to $1.26 billion for the comparable period in 2016. Interest expense also declined during the year by 6% to close at $847.44 million compared to $898.37 million in 2016. As a result, net interest income declined by 22% to $286.87 million relative to $366.05 million in 2016. BIL has attributed the performance in the year to declining interest rates.
Dividend Income fell 19% to total $20.59 million compared to the $25.55 million earned in 2016. Gains on sale of investment grew by 45%, to $259.32 million (2016: $179.28 million). Income from Fees & Commissions rose by 38%, to close at $475.73 million (2016: $343.55 million) this increase was due to “an increase in funds under management.”
Foreign exchange trading and translation gains declined by 53% to a total of $45.48 million for the year, compared to $96.39 million recorded in the previous year. Other Income amounted to $22 million, up 233% from $6.61 million reported for the prior financial year.
Administrative Expenses for the period amounted to $337.50 million, increasing 4% from $324.28 million in 2016. Staff costs rose marginally to total $340.58 million (2016: $340.49 million).
Notably, BIL reported Impairment of available-for-sale investment of $100.16 million (2016: $4.69 million). Nil was recorded for Share of results of investment in associated company for 2017 compared to a loss of $6.92 million in 2016.
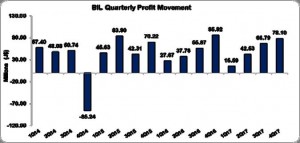
Profit before taxation for the year amounted to $331.74 million versus $341.08 million recorded in 2016.
Consequently, the company reported net profits of $203.02 million, a decline relative to the $207.22 million booked in 2016; this followed taxation of $128.72 million (2016: $133.86 million). Total Comprehensive Income for the year amounted to $330.69 billion compared to $690.69 billion in 2016.
Earnings per Share for the year ended September 30, 2017, totalled $0.46 relative to $0.47 in 2016. The number of shares used in our calculations amounted to 445,001,824 units. The company closed the at $7.94 as at the end of trading on December 22, 2017.
Balance Sheet at a glance:
As at September 30, 2017, total assets amounted $15.85 billion (2016: $14.77 billion), a $1.08 billion improvement mainly due to a growth in ‘Pledged Assets’ which increased by 25% to a total of $8.03 billion (2016: $6.44 billion). ‘Securities Purchased Under Resale Agreements’ also contributed to the upward movement in the total asset base with a 26% or $702.07 million increase to close at $3.39 billion (2016: $2.69 billion). total assets growth was however tempered by a 36% decline in ‘Marketable Securities’ which closed the financial year at $2.53 billion relative to $3.94 billion a year earlier.
Shareholders’ Equity amounted to $2.78 billion relative to $2.49 billion in 2017 resulting in a book value per share of $6.23 relative to $5.59 in 2016.
The information contained herein has been obtained from sources believed to be reliable, however its accuracy and completeness cannot be guaranteed. You are hereby notified that any disclosure, copying, distribution or taking any action in reliance on the contents of this information is strictly prohibited and may be unlawful. Mayberry may effect transactions or have positions in securities mentioned herein. In addition, employees of Mayberry may have positions and effect transactions in the securities mentioned herein.


