
Results for the year ended September 30, 2017:
Revenues for the year increased by 19% to $1.21 billion, compared to $1.02 billion for the prior financial year. CAC revenues for the fourth quarter increased 22% to $411.75 million relative to $338.77 million for the comparable period in 2016. Cost of Sales also increased, by 29% to close at $786.50 million for the year (2016: $607.53 million). Consequently, Gross Profit improved by 3% to $424.44 million (2016: $410.08 million), while for the quarter, CAC booked gross profit of $147.96 million (2016: $154.61 million).
For the quarter the company saw a 17% decline in Total Expenses to close at $91.46 million (2016: $78.04 million). For the year ended September 2017 there was a 7% increase in Total Expenses to $308.90 million (2016: $255.50 million). This was as a result of a 17% upward movement in Selling & Distribution Expenses to $37.42 million (2016: $31.85 million) as well as a 6% increase in General Administration to $271.48 million (2016: $255.50 million).
There was a $1.95 million increase in in Other Income to $2.12 million from $169,411 reported for the same period the prior year. Consequently, Profit before finance cost and taxation surged 529% to close at $117.65 million compared to $18.72 million in 2016. This was as a result of $104.18 million booked for ‘Court awarded damages’ in 2016.
Net Finance Costs increased significantly for the period in review to $17.14 million (2016: $7.40 million).
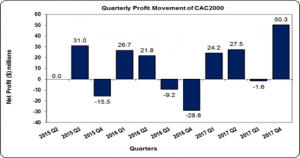
Profit Before Taxation increased 788% for the year and closed at $100.51 million (2016: $11.32 million). Tax charges of $222,812 compared to a tax charge of $845,746 for 2016. Year-end profit amounted to $100.29 million compared to $10.47 million reported for 2016. Net Profit for the quarter amounted to $50.28 million compared to a Net Loss of $28.81 million incurred for the corresponding quarter of 2016.
Earnings-per-share (EPS) for the financial year totaled $0.78 compared to $0.08 in 2016, while the earnings per share for the quarter amounted to $0.39 relative to a loss of $0.22 in 2016. The twelve months trailing EPS amounted to $0.78. The number of shares used in our calculations is 129,032,258 units. The stock ended trading on January 4, 2017 at $6.50.
Balance Sheet Highlights:
As at September 30, 2017, the Company reported total assets of $985.21 million, a $133.50 million increase when compared to $851.71 million a year ago. This was mainly due to a year over year 50% increase in Trade and Receivables and a 21% year over year increase in Cash and Bank deposits.
Shareholders’ Equity as at October 30, 2017 was $423.09 million compared to $322.36 million a year ago. This resulted in a book value per share of $3.28 compared to $2.50 in 2016.
Company Disclosure -The information contained herein has been obtained from sources believed to be reliable, however its accuracy and completeness cannot be guaranteed. You are hereby notified that any disclosure, copying, distribution or taking any action in reliance on the contents of this information is strictly prohibited and may be unlawful. Mayberry may effect transactions or have positions in securities mentioned herein. In addition, employees of Mayberry may have positions and effect transactions in the securities mentioned herein.


