
Date: August 14, 2018
Caribbean Flavours & Fragrances Limited’s (CFF), for the year ended June 30, 2018, revenue increased by 3% to $423.68 million relative to $410.64 million for the comparable period in 2017. For the quarter, the Company generated revenue of $120.71 million, a 10% increase year over year.
Cost of sales also increased for the period to $255.72 million. This compares to the prior year’s figure of $242.69 million, representing an increase of 5%. Gross profit increased slightly to $167.97 million for the period in review and compares to the prior year’s amount of $167.94 million. CFF highlighted that, “The company expects that there will be improvements in the upcoming quarters, as our sugar replacement substitute ‘Flavour Fit’ is gaining traction with the larger manufacturers and we anticipate to start seeing returns in the next reporting period.”
The company also noted that, “We will continue with the implementation of strategies geared towards managing our costs with a view to improving our efficiency and our profitability.”
The company had a marginal year over year decrease in total expenses to $92.48 million down from $95.01 million in 2017. There was a 20% decrease in selling & distribution expenses to $5.09 million (2017: $6.33 million). Whereas, Administrative Expense for the period slightly decreased to $87.39 million versus the prior year’s corresponding total of $88.69 million.
Consequently, Profit from Operations for the period increased to $75.49 million versus $72.93 million booked for the year ended June 30, 2018. While for the quarter, there was a 12% increase from $21.93 million to $24.55 million. The company reported a 9% increase in net finance income from $10.78 million in 2017 to $11.72 million in 2018.
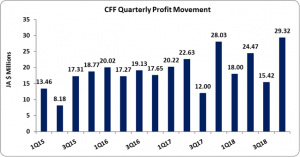
As a result, net profit for the period amounted to $87.21 million representing a 5% increase from the comparable period’s figure of $82.88 million, while for the quarter, net profit also increased by 5% from $28.03 million to $29.32 million.
The earnings per share for the year amounted to $0.97 (2017: $0.92). While, the EPS for the quarter amounted at $0.33 (2017: $0.31). The number of shares used in this calculation was 89,920,033 units. As at August 14, 2018 the stock traded at $14.50.
Balance Sheet Highlights:
The company, as at June 30, 2018, recorded total assets of $452.17 million, an increase of 20% when compared to $376.11 million for the prior year. Cash and bank balance increased to $83.30 million from the $67.83 million reported in prior year. There was also an increase in inventories, by 39%, to $134.92 million (2017: $97.22 million).
Total Stockholders’ equity as at June 30, 2018 closed at $417.78 million, an improvement of 26% from $330.57 million last year. This resulted in a book value per share of $4.65 compared to a book value of $3.68 for the last year.
Disclaimer:
Analyst Certification -The views expressed in this research report accurately reflect the personal views of Mayberry Investments Limited Research Department about those issuer (s) or securities as at the date of this report. Each research analyst (s) also certify that no part of their compensation was, is, or will be, directly or indirectly, related to the specific recommendation (s) or view (s) expressed by that research analyst in this research report.
Company Disclosure -The information contained herein has been obtained from sources believed to be reliable, however its accuracy and completeness cannot be guaranteed. You are hereby notified that any disclosure, copying, distribution or taking any action in reliance on the contents of this information is strictly prohibited and may be unlawful. Mayberry may effect transactions or have positions in securities mentioned herein. In addition, employees of Mayberry may have positions and effect transactions in the securities mentioned herein.


