
Date: March 04, 2019
Revenue rose by 24% to $1.29 billion relative to 2017’s $1.05 million). Revenue for the quarter amounted to $347.33 million, 39% above the $250 million booked for the similar quarter of 2017.
Cost of sales increased by 32% to $759.23 million (2017: 573.01 million). As a result, gross profit increased by 13% to $534 million compared to $473.23 million in 2017. Gross profit for the quarter amounted to $123.64 million (2017: $113.10 million).
Other income totalled $47.41 million for the period relative to the previous year’s gain of $41.91 million.
Total expenses increased by 7% to $490.29 million (2017: $456.26 million). Of this, administrative and other expenses increased to $422.79 million (2017: $404.83 million), while finance costs expenses recorded an increase of 31%, closing at $67.50 million (2017: $51.43 million). Total expenses for the quarter amounted to $133.57 million compared to $123.03 million.
Consequently, profit before taxation amounted to $91.11 million relative to $58.88 million in 2017, representing a 55% increase year-on-year.
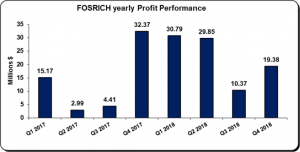
Tax charges for the year was $718,259, a 82% decrease when compared with $3.94 million. As a result, net profit for the year amounted to $90.39 million relative to $54.94 million. Net profit for the quarter amounted to $19.37 million (2017: $32.37 million).
Earnings per share amounted to $0.18 for the period relative to earnings per share of $0.11 in 2017. EPS for the quarter amounted to $0.04 (2017: $0.06). The number of shares used in our calculations is 502,275,555. Notably, FOSRICH stock price close the trading period on March 04, 2019 at $3.87.
Balance Sheet Highlights:
The company, as at December 31, 2018, recorded total assets of $2.05 million, an increase of 58% when compared to $1.3 million recorded last year. The increase was mainly attributed to inventories which closed at $1.02 billion versus $625.06 million in 2017.
Total Stockholders’ Equity as at December 31, 2018, closed at $693.35 million (2017: $604.93 million) resulting in a book value per share of $1.38 per share compared to $1.20.
Analyst Certification -The views expressed in this research report accurately reflect the personal views of Mayberry Investments Limited Research Department about those issuer (s) or securities as at the date of this report. Each research analyst (s) also certify that no part of their compensation was, is, or will be, directly or indirectly, related to the specific recommendation (s) or view (s) expressed by that research analyst in this research report.
Company Disclosure -The information contained herein has been obtained from sources believed to be reliable, however its accuracy and completeness cannot be guaranteed. You are hereby notified that any disclosure, copying, distribution or taking any action in reliance on the contents of this information is strictly prohibited and may be unlawful. Mayberry may effect transactions or have positions in securities mentioned herein. In addition, employees of Mayberry may have positions and effect transactions in the securities mentioned herein.

