
Grace Kennedy Limited (GK), for the three months ended March 31, 2018, recorded revenue of $24.91 billion for year (2017: $23.69 billion), a year over year increase of 5%. The biggest contributor to the group’s overall revenue for the quarter was income from the ‘Food Trading’ segment which contributed a total of $19.98 billion (2017: $18.82 billion), an increase of 5% relative to the prior year’s corresponding period. Management noted, “the Food Trading segment grew in both revenue and pre-tax profit when compared to the corresponding period of 2017 due to improved performance in both our Jamaican and International food business.”
Among the other segments contributing to revenue growth was, ‘Insurance’ which recorded an 18% increase to $1.61 billion (2017: $1.36 billion). The Insurance segment results according to GK, “were mainly due to growth in the Commercial Lines portfolio. GK Insurance Eastern Caribbean continued its expansion initiatives and in the quarter commenced operations in Antigua adding to location already established in St. Lucia and St. Vincent.”
‘Banking & Investments’ posted a 2% decline to $1.51 billion (2017: $1.54 billion), while ‘Money Services’ brought in $1.81 billion (2017: $1.97 billion), a slight decrease year over year by 8%. However GK noted, “First Global Bank (FGB) reported growth in pre-tax profit mainly driven by lower cost of funds and lower expenses. In keeping with our financial inclusion strategy FGB opened its third satellite location in Linstead, St. Catherine, Jamaica through the First Global MoneyLink brand.”
Total Expenses amounted to $24.20 billion relative to $22.77 billion booked for the comparable period in 2017, a 6% growth. Other Income improved 61% to total $733.81 million (2017: $456.52 million). As such, ‘Profit from Operations’ amounted to $1.45 billion, a 5% growth year over year from $1.38 billion booked in as at March 2017.
Interest income from non-financial services rose 7% to total $100.64 million compared to $94.44 million reported a year earlier. Interest expenses from non-financial services amounted to $143.83 million versus $163.67 million booked for the corresponding period in 2017, a 12% reduction.
Share of results of associated companies recorded a marginal increase amounting to $259.92 million, compared to $259.20 million reported for the corresponding quarter of 2017.
Pre-tax profits increased 6% to approximately $1.66 billion, compared to pre-tax profit of $1.57 billion documented for the previous year’s corresponding quarter. GK incurred taxation expenses amounting to approximately $349.14 million compared to $422.76 billion in 2017. Consequently, net profit increased by 15% to $1.31 billion from $1.14 billion booked in 2017.
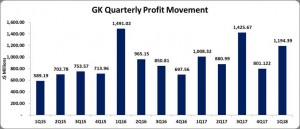
Net Profits attributable to shareholders amounted to $1.19 billion compared to $1.01 billion a year earlier, reflecting an 18% increase. Earnings per share (EPS) for quarter amounted to $1.20 (2017: $1.01), while the twelve month trailing earnings per share amounted to $4.32. The number of shares used in our calculations is 994,886,892 units. Notably, GK’s stock price closed the trading period on May 10, 2018 at $48.37.
Total Comprehensive Income attributed to shareholders for the quarter amounted to $1.05 billion compared to $1.78 billion in 2017.
Balance Sheet Highlights:
As at March 31, 2018, the company’s assets totalled $129.14 billion, 2% or $2.34 billion more than its value a year ago. The improvement resulted in part from a growth in ‘Investment Securities’ by $5.12 billion to $30.31 billion (2017: $25.20 billion). Fixed assets recorded growth of 14% year over year to close at $12.01 billion versus $10.51 billion a year earlier. Receivables reflected an increase of $2.81 billion to $17. Billion (2017: $14.20 billion). Loans Receivables decreased 3% to close at $25.59 billion relative to the $26.21 billion reported in 2017.
Shareholders’ equity amounted to $45.39 billion which compares to equity of $43.86 billion as at March 31, 2018. As a result, book value per share amounted to $47.25 (2016: $45.62).
Disclaimer:
Analyst Certification -The views expressed in this research report accurately reflect the personal views of Mayberry Investments Limited Research Department about those issuer (s) or securities as at the date of this report. Each research analyst (s) also certify that no part of their compensation was, is, or will be, directly or indirectly, related to the specific recommendation (s) or view (s) expressed by that research analyst in this research report.
Company Disclosure -The information contained herein has been obtained from sources believed to be reliable, however its accuracy and completeness cannot be guaranteed. You are hereby notified that any disclosure, copying, distribution or taking any action in reliance on the contents of this information is strictly prohibited and may be unlawful. Mayberry may effect transactions or have positions in securities mentioned herein. In addition, employees of Mayberry may have positions and effect transactions in the securities mentioned herein.

