Industrial producer prices in October 2017 rose 0.4% in the euro area relative to September 2017. The movement was due to a 1.3% climb in the energy sector and a 0.3% growth for intermediate goods. Prices for capital and durable consumer good remained stable, while non-durable goods recorded a 0.2% decline.
In the EU28, a similar increase of 0.4% was observed due to a 1.2% upward movement in the energy sector and a 0.3% growth for intermediate goods. According to EUROSTAT, “prices remained stable for both capital and durable consumer goods and fell by 0.1% for non-durable consumer goods. Prices in total industry excluding energy rose by 0.1%.”
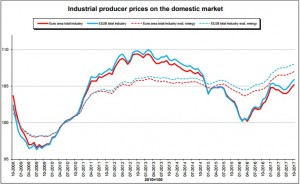
Annual Comparison
Year over year, industrial prices increased 2.5% in total industry in the euro area in October 2017. The movement was due to 3.5% upward movement or intermediate goods, 3.1% growth in the energy sector and a 1.9% increase for non-durable consumer goods. Capital goods and durable consumer goods both recorded growths 0.9% and 0.6% respectively. The total industry excluding energy climbed 2.3%. In the EU28, prices trended upward by 2.6%, according to EUROSTAT, “price increase is due to rises of 3.6% for intermediate goods, of 3.5% in the energy sector, of 2.3% for non-durable consumer goods and of 0.9% for both capital and durable consumer goods. Prices in total industry excluding energy rose by 2.5%.”
Industrial producer prices increased in all Member States, with the largest growths recorded in Belgium (+6.9%), Bulgaria (+5.5%), Poland (+4.5%), Hungary (+4.4%) and Ireland (+4.3%).
The information contained herein has been obtained from sources believed to be reliable, however its accuracy and completeness cannot be guaranteed. You are hereby notified that any disclosure, copying, distribution or taking any action in reliance on the contents of this information is strictly prohibited and may be unlawful. Mayberry may effect transactions or have positions in securities mentioned herein. In addition, employees of Mayberry may have positions and effect transactions in the securities mentioned herein.


