
ISP Finance Services Limited (ISP)
Results for the Nine Months ended September 30, 2017:
For the nine months period ended September 30, 2017, ISP Finance Services Limited’s (ISP) Total Interest Income amounted to $210.70 million compared to $168.80 million in 2016, an increase of 25%. For the quarter, Total Interest income amounted to $74.91 million (2016: $64.39 million). It is broken down as follows:
- Interest Income from Loans grew by 25% to total $208.78 million relative to $167.4 million reported in the same period of 2016.
- Interest Income Receivables was up 37%, amounting to $1.92 million (2016: $1.40 million).
Interest Expense totaled $18.65 million relative to $13.21 million in 2016; this represents a 41% increase. As a result, Net Interest Income grew by 23% to total $192.06 million (2016: $155.59 million).
Commission Expense grew by 62% to $2.37 million (2016: $1.47 million). Foreign Exchange Gain totaled $1.23 million (2016: Nil).
The company’s Total Operating Expense amounted to $160.24 million down from $133.59 million in 2016. The expenses are broken down as follows:
- Staff Costs amounted to $81.09 million (2016: $70.92 million)
- Allowance for Credit Loss totalled $15.74 (2016: $11.42 million)
- Depreciation was $4.04 million (2016: $2.53 million)
- Other Operating Expenses amounted to $59.38 million (2016: $48.73 million)
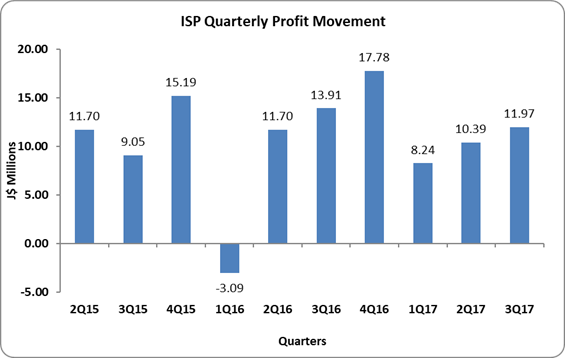
Consequently, Net Profit for the period amounted to $30.67 million relative to a profit of $22.52 million in 2016, a 36% increase. Net profit for the quarter amounted to $11.97 million (2016: $13.91 million).
As a result, EPS for the period closed at $0.29 (2016: EPS $0.21). The EPS for the quarter was $0.11 (2016: $0.13). The 12-month trailing EPS is $0.46 and the number of shares used in our calculations is 105,000,000 units.
Balance Sheet Highlights:
A at September 30, 2017, ISP reported total assets of $448.12 million, a 0.14% decline when compared to $448.74 million in the prior year.
Shareholders’ Equity as at September 30, 2017 was $264.62 million compared to a $216.66 million in 2016. This resulted in a book value per share of $2.52 compared to $2.06 the prior year.
Disclaimer:
Analyst Certification -The views expressed in this research report accurately reflect the personal views of Mayberry Investments Limited Research Department about those issuer (s) or securities as at the date of this report. Each research analyst (s) also certify that no part of their compensation was, is, or will be, directly or indirectly, related to the specific recommendation (s) or view (s) expressed by that research analyst in this research report.
Company Disclosure -The information contained herein has been obtained from sources believed to be reliable, however its accuracy and completeness cannot be guaranteed. You are hereby notified that any disclosure, copying, distribution or taking any action in reliance on the contents of this information is strictly prohibited and may be unlawful. Mayberry may effect transactions or have positions in securities mentioned herein. In addition, employees of Mayberry may have positions and effect transactions in the securities mentioned herein.


