
May 18, 2026
ISP Finance Services Limited (ISP)
Unaudited financials for the first quarter ended March 31, 2026:
ISP Finance Services Limited (ISP) for the first quarter ended March 31, 2026, reported a 16% decrease in total interest income, totalling $83.21 million, compared to $99.21 million in the corresponding three months last year.
Interest Expense amounted to $14.25 million (2025: $12.53 million), which represents an increase of 14% year over year. Consequently, net interest income decreased by 20% to $68.96 million compared to $86.67 million for the first quarter ended March 31, 2025.
Commission Expense on loans decreased by 13% from $3.15 million in 2025 to $2.73 million for the three months. As a result, Gross Profit decreased by 21% to close at $66.23 million (2025: $83.52 million).
Allowance for Credit Loss for the three months amounted to $15.00 million, a 44% decrease relative to $26.71 million reported in 2025. Other operating expenses totalled $28.25 million, a 25% increase from last year’s corresponding period (2025: $22.55 million), while Staff costs increased by 10% to $23.31 million (2025: $21.13 million). Additionally, depreciation increased by 22% amounting to $1.44 million (2025: $1.85 million). Consequently, Total Operating Expenses for the first quarter amounted to $68.00 million, a 6% decrease relative to $72.24 million reported in 2025.
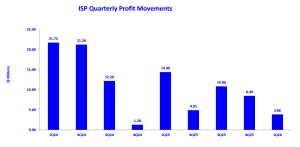
Profit Before Taxation for the first quarter ended March 31, 2026, amounted to $4.63 million, a 73% decrease relative to $17.28 million reported in 2025.
Taxation for the three months decreased 73% to $772,045 (2025: $2.88 million). Net Profit for the three months amounted to $3.86 million, a 73% decrease from the $14.40 million reported in 2025.
Consequently, Earnings Per Share for the three months amounted to $0.04 (2025: EPS: $0.14). The twelve-month trailing EPS was $0.27, and the number of shares used in these calculations was 105,000,000. Notably, ISP’s stock closed the trading period on May 15, 2026, at a price of $12.47, with a corresponding P/E ratio of 46.57x.
Balance Sheet Highlights
The company’s assets totalled $1.22 billion (2025: $1.29 billion). The decline in the company’s asset base reflects an 85% YoY decline in Other Receivables, which closed the quarter at $7.55 million (2025: $51.38 million); a 39% YoY decline in Cash & Cash Equivalents, totalling $73.08 million (2025: $119.91 million); and a 60% YoY decline in Marketable Securities/Investments amounting to $10.00 million (2025: $25.00 million). These were partly offset by a 26% YoY increase in Property, Plant and Equipment, ending at $29.58 million (2025: $23.55 million) and a significant build-up in Right-of-Use assets to $25.27 million (2025: $1.44 million).
Shareholder’s equity was $661.78 million (2025: $654.97 million), representing a book value per share of $6.30 (2025: $6.24).
Disclaimer:
Analyst Certification – The views expressed in this research report accurately reflect the personal views of Mayberry Investments Limited Research Department about those issuer (s) or securities as at the date of this report. Each research analyst (s) also certify that no part of their compensation was, is, or will be, directly or indirectly, related to the specific recommendation (s) or view (s) expressed by that research analyst in this research report.
Company Disclosure – The information contained herein has been obtained from sources believed to be reliable, however its accuracy and completeness cannot be guaranteed. You are hereby notified that any disclosure, copying, distribution or taking any action in reliance on the contents of this information is strictly prohibited and may be unlawful. Mayberry may effect transactions or have positions in securities mentioned herein. In addition, employees of Mayberry may have positions and effect transactions in the securities mentioned herein.


