
February 16, 2026
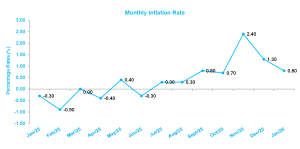
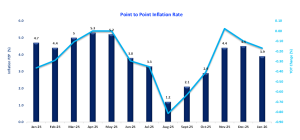
The Statistical Institute of Jamaica (STATIN) reported that as of January 2026, the point‑to‑point inflation rate was +3.9%, representing a 0.6 percentage point decrease relative to the 4.5% recorded for the period December 2025 to December 2025. Compared to December 2025, the All‑Jamaica Consumer Price Index (CPI) increased by 0.8% in January 2026.
The All Jamaica Consumer Price Index (CPI) fell by 0.8% in January 2026, driven mainly by a 2.6% decline in the ‘Food and Non‑Alcoholic Beverages’ division. This was largely influenced by a significant 9.9% drop in the index for ‘Vegetables, tubers, plantains, cooking bananas and pulses’ and an 8.4% decrease in the ‘Ready‑made food and other food products’ class. These reductions reflected lower prices for items such as cabbage, carrot, cucumber, escallion, sweet pepper and tomato, stemming from an increased supply of local produce. Offsetting some of this downward movement was a 0.7% rise in the index for ‘Housing, Water, Electricity, Gas and Other Fuels’, mainly due to higher water and sewage charges. Additionally, the ‘Education’ division recorded a 1.0% increase, reflecting higher preparatory school fees.
The All‑Jamaica point‑to‑point inflation rate for the period January 2025 to January 2026 was 3.9%. The divisions contributing most to this outturn were ‘Food and Non‑Alcoholic Beverages’ (+5.7%), ‘Housing, Water, Electricity, Gas and Other Fuels’ (+4.6%) and ‘Personal Care, Social Protection and Miscellaneous Goods and Services’ (+4.1%).
Within the ‘Food and Non‑Alcoholic Beverages’ division, the ‘Fish and other seafood’ class recorded the largest impact, rising by 12.6%. This increase was driven mainly by higher prices for salted fish, sardines, mackerel and sliced fish. There was also a 5.5% increase in the ‘Vegetables, tubers, plantains, cooking bananas and pulses’ class, reflecting higher prices for items such as yellow yam, tomato, carrot and green banana.
In the ‘Housing, Water, Electricity, Gas and Other Fuels’ division, the 4.6% point‑to‑point increase was influenced primarily by a 5.1% rise in the index for ‘Imputed Rentals for Housing’. Additionally, the index for ‘Water Supply and Miscellaneous Services Relating to the Dwelling’ increased by 7.9%, largely due to higher water supply and sewage charges.
The 4.1% increase in the ‘Personal Care, Social Protection and Miscellaneous Goods and Services’ division was mainly attributed to a 4.1% rise in the ‘Personal Care’ group, reflecting increased prices for services provided by hairdressers, barbers and nail technicians.
MAJOR CPI DIVISION MOVEMENTS
The ‘Food and Non‑Alcoholic Beverages’ division recorded a 2.6% decline, driven mainly by a 2.8% fall in the ‘Food’ group. This was influenced by sharp reductions of 9.9% in ‘Vegetables, tubers, plantains, cooking bananas and pulses’ and 8.4% in ‘Ready‑made foods and other food products’, reflecting lower prices for items such as cabbage, carrot, cucumber, escallion, sweet pepper and tomato due to increased local supply. Offsetting some of the decline were modest increases in ‘Meat and other parts of slaughtered land animals’ (+0.4%), ‘Fish and Seafood’ (+1.0%) and ‘Milk, other dairy products and eggs’ (+1.3%). All classes under ‘Non‑Alcoholic Beverages’ also rose slightly, with increases ranging from 0.2% to 0.3%.
Point‑to‑point inflation rate: 5.7%
The index for ‘Alcoholic Beverages, Tobacco and Narcotics’ division increased by 0.1%, stemming from a 0.2% rise in ‘Alcoholic Beverages’. Within that group, prices for spirits and liquors, wine and beer all saw marginal upticks of 0.1% to 0.2%.
Point‑to‑point inflation rate: 2.3%
The index for ‘Clothing and Footwear’ rose by 0.2% in January. Both the ‘Clothing’ group and the ‘Footwear’ group contributed to this upturn, with increases of 0.2% and 0.4%, respectively.
Point‑to‑point inflation rate: 3.1%
The index for ‘Housing, Water, Electricity, Gas and Other Fuels’ increased by 0.7%, largely driven by a 5.3% rise in ‘Water Supply and Miscellaneous Services Relating to the Dwelling’, following higher water and sewage rates.
Point‑to‑point inflation rate: 4.6%
The index ‘Furnishings, Household Equipment and Routine Household Maintenance’ increased by 0.2%, supported mainly by a 0.3% rise in ‘Goods and Services for Routine Household Maintenance’, reflecting higher prices for certain household cleaning items. Other contributing groups—such as furniture, tools and equipment, and household textiles—also recorded small increases ranging from 0.1% to 0.3%.
Point‑to‑point inflation rate: 3.2%
The index ‘Health’ rose by 0.4%, influenced by a 0.3% increase in ‘Medicines and Health Products’, driven by higher prices for over‑the‑counter flu treatments and pain relievers. Additionally, ‘Outpatient Care Services’ increased by 1.0% due to higher fees for general practitioners and gynecologists.
Point‑to‑point inflation rate: 4.2%
The index ‘Transport’ fell by 0.2%, mainly due to a 1.5% decline in ‘Fuels and Lubricants for Personal Transport Equipment’, reflecting lower petrol prices.
Point‑to‑point inflation rate: 0.1%
The index ‘Recreation, Sport and Culture’ increased by 0.7%, primarily impacted by a strong 10.7% rise in ‘Cultural Services’. A smaller increase of 0.3% in ‘Newspapers, Books and Stationery’ also contributed to the overall movement.
Point‑to‑point inflation rate: 3.3%
The index ‘Education’ rose by 1.0%, influenced mainly by a 1.2% increase in ‘Pre‑primary and Primary Education’, reflecting higher preparatory school fees.
Point‑to‑point inflation rate: 8.1%
The index ‘Restaurants and Accommodation Services’ rose by 0.2%, attributed to higher prices for meals consumed away from home.
Point‑to‑point inflation rate: 1.8%
The index ‘Personal Care, Social Protection and Miscellaneous Goods and Services’ rose by 0.7%, driven mainly by a 0.8% increase in the ‘Personal Care’ group, reflecting higher prices for services such as haircuts and manicures.
Point‑to‑point inflation rate: 4.1%
Individual Divisional Monthly Changes – January 2026
- Food and Non‑Alcoholic Beverages: (-2.6%)
- Alcoholic Beverages, Tobacco and Narcotics: (+0.1%)
- Clothing and Footwear: (+0.2%)
- Housing, Water, Electricity, Gas and Other Fuels: (+0.7%)
- Furnishings, Household Equipment and Routine Household Maintenance: (+0.2%)
- Health: (+0.4%)
- Transport: (-0.2%)
- Recreation, Sport and Culture: (+0.7%)
- Education: (+1.0%)
- Restaurants and Accommodation Services: (+0.2%)
- Personal Care, Social Protection and Miscellaneous Goods and Services: (+0.7%)
Disclaimer:
Analyst Certification – The views expressed in this research report accurately reflect the personal views of Mayberry Investments Limited Research Department about those issuer (s) or securities as at the date of this report. Each research analyst (s) also certify that no part of their compensation was, is, or will be, directly or indirectly, related to the specific recommendation (s) or view (s) expressed by that research analyst in this research report.
Company Disclosure – The information contained herein has been obtained from sources believed to be reliable, however its accuracy and completeness cannot be guaranteed. You are hereby notified that any disclosure, copying, distribution or taking any action in reliance on the contents of this information is strictly prohibited and may be unlawful. Mayberry may affect transactions or have positions in securities mentioned herein. In addition, employees of Mayberry may have positions and effect transactions in the securities mentioned herein.


