
April 30, 2018
Caribbean Cream Ltd. (KREMI) for year ended February 28, 2018, reported a 13% increase in revenue totalling $1.37 billion compared to $1.21 billion in the corresponding period last year. Revenue for the fourth quarter rose 16% to close at $381.04 million compared to $327.92 million for the comparable quarter of 2017.
Costs of Sales for the period amounted to $952.95 million (2017: $751.71 million), an increase of 27%. As such, Gross Profit fell 9% or $41.51 million to close at $420.32 million compared to $461.84 million for the period ended February 28, 2017. The company booked gross profit of $114.88 million for the fourth quarter versus $117.78 million reported for the similar quarter of 2017.
Administrative Expenses climbed 19% to close at $275.03 million (2017: $231.79 million), while Selling and Distribution Costs declined 2% from $47.78 million to close the period at $46.64 million. Consequently, operating profit for the year ended amounted to $100.90 million, down 45% relative to $184.57 million book in 2017.
Finance Cost rose 14% year over year to amount to $15.26 million relative to $13.41 million recorded for the comparable period in 2017. Interest income for the period reflected an 18% decline from $5.03 million to $4.12 million for year end.
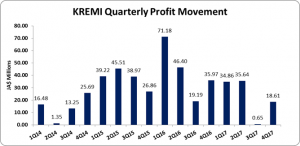
No taxes were charged for the period, as such Net Profit Attributable to Shareholders decreased by 49% from $176.18 million in 2017 to $89.75 million. Profit for the quarter amounted to $18.61 million (2017: $39.42 million), down 53% year over year. Consequently, Earnings per Share (EPS) for the period amounted to $0.24 (2017: $0.47), while the EPS for the quarter totalled $0.049 (2017: $0.104). The numbers of shares used in these calculations were 378,568,115 units. KREMI’s stock price close the trading period on April 27, 2018 at a price of $5.09.
Balance Sheet Highlights:
The company’s assets totalled $848.03 million (2017: $791.33 million), $56.70 million more than its value as at February 28, 2017. The increase in assets was largely due to an increase of $113.38 million in ‘property, plant and equipment to a total of $514.63 million (2017: $401.24 million). ‘Inventory’ and ‘Cash and Cash Equivalents’ declined as at February 28, 2018 to close as $92.71 million (2017: $161.22 million) and $174.73 million (2017: $176.18 million) respectively.
Shareholders’ equity amounted to $637.49 million (2017: $570.45 million), representing a book value per share of $1.68 (2017: $1.51).
The information contained herein has been obtained from sources believed to be reliable, however its accuracy and completeness cannot be guaranteed. You are hereby notified that any disclosure, copying, distribution or taking any action in reliance on the contents of this information is strictly prohibited and may be unlawful. Mayberry may effect transactions or have positions in securities mentioned herein. In addition, employees of Mayberry may have positions and effect transactions in the securities mentioned herein.


