
April 14, 2026
OMNI INDUSTRIES LIMITED (OMNI)
Audited Financials for the Twelve Months Ended December 31, 2025:
Omni Industries Limited (OMNI) for the twelve months ended December 31, 2025 reported a 14% increase in Revenue totalling $2.19 billion compared to $1.92 billion in the corresponding period last year.
Cost of Sales amounted to $1.58 billion (2024: $1.29 billion), representing an increase of 23% year over year. Consequently, Gross Profit decreased by 5% to $606.53 million compared to $636.78 million for the twelve months ended December 31, 2024. Gross margin contracted from 33.1% to 27.7%, as cost growth outpaced revenue expansion.
Other Income increased by 25% to close at $31.47 million (2024: $25.26 million), while Administrative Expenses decreased by 9% from $305.35 million in 2024 to $278.66 million in the period under review, with notable savings in professional fees and transfer tax. Additionally, Selling Expenses for the twelve months ended December 31, 2025 amounted to $178.08 million, essentially flat relative to $177.94 million reported in 2024.
Operating Profit for the twelve months ended December 31, 2025 amounted to $181.26 million, a 1% increase relative to $178.74 million reported in 2024. Finance Costs totalled $39.26 million, a 5% increase from the corresponding period last year (2024: $37.57 million).
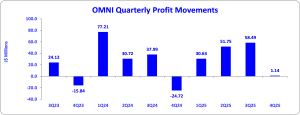
Profit before Taxation for the twelve months ended December 31, 2025 amounted to $142.00 million, a marginal increase of 0.6% relative to $141.17 million reported in 2024.
Notably, no taxation was charged for the twelve months ended December 31, 2025 (2024: $14.57 million). Net Profit for the twelve months amounted to $142.00 million, a 12% increase from the $126.60 million reported in 2024.
Consequently, Earnings Per Share for the twelve months amounted to $0.06 (2024: $0.05). The number of shares used in these calculations was 2,500,000,000.
Notably, OMNI’s stock price closed the trading period on April 13, 2026 at a price of $0.98 with a corresponding P/E ratio of 16.33x.
Balance Sheet Highlights
The company’s assets totalled $1.86 billion (2024: $1.65 billion), a 13% increase year over year. The movement in total assets was primarily attributable to a 38% increase in Property, Plant and Equipment amounting to $607.78 million (2024: $441.10 million), driven by $217.76 million in capital expenditure, up 212% from $69.85 million in 2024, as the company accelerated investment in machinery and buildings to expand manufacturing capacity. Inventories remained broadly stable at $824.74 million (2024: $812.76 million), while Receivables increased by 7% to $413.88 million (2024: $387.43 million). Cash and Bank closed at $9.09 million (2024: $7.33 million).
Shareholders’ equity was $1.07 billion (2024: $927.03 million), representing a book value per share of $0.43 (2024: $0.37).
Disclaimer:
Analyst Certification -The views expressed in this research report accurately reflect the personal views of Mayberry Investments Limited Research Department about those issuer (s) or securities as at the date of this report. Each research analyst (s) also certify that no part of their compensation was, is, or will be, directly or indirectly, related to the specific recommendation(s) or view (s) expressed by that research analyst in this research report.
Company Disclosure -The information contained herein has been obtained from sources believed to be reliable, however its accuracy and completeness cannot be guaranteed. You are hereby notified that any disclosure, copying, distribution or taking any action in reliance on the contents of this information is strictly prohibited and may be unlawful. Mayberry may affect transactions or have positions in securities mentioned herein. In addition, employees of Mayberry may have positions and effect transactions in the securities mentioned herein.


