
May 15,2018
PanJam Investment Limited (PJAM) for the three months ended March 31, 2018, reported a 4% increase in total income to total $523.51 million relative to $501.56 million booked for the prior year’s corresponding period. The Company noted this was as a result of, “lower investment income being offset by higher property income and stronger share of results of associated companies, led by Sagicor.” Of total income:
- Other income declined 11% or $3.85 million from $36.08 million to $32.23 million.
- Investments fell 61% to close at $43.56 million (2017: $110.99 million). This was impacted by, “by unrealised losses relative to unrealised and realised gains in the prior year, caused mainly by mark to market losses during the quarter on certain securities relative to year-end prices.”
- Property income amounted to $447.72 million, up 26% year over year. The movement was linked, “to improved rentals and higher property revaluation gains”
Operating expenses amounted to $371.60 million for three months ended March 31, 2018 (2017: $333.61 million), 11% more than its total a year prior, “as a result of higher energy rates and updated actuarial calculations of group health and life costs,” Management noted.
Consequently, operating profits declined by 10% to a total of $151.91 million relative to $167.94 million a year earlier.
Finance costs for the period rose by 25%, amounting to $160.94 million compared to the $129.11 million for the comparable period in 2017. According to the Company this was attributed to, “higher debt balances”. Share of results of associated companies improved to closed the quarter at $855.51 million, versus $817.66 million booked twelve months earlier.
Profit before taxation declined 1%, closing the period at $846.47 million (2017: $856.49 million). Following taxation of $11.15 million (2017: $14.42 million), Net Profit amounted to $835.32 million (2017: $842.07 million).
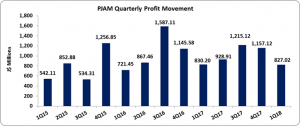
Net Profit Attributable to Shareholders for the period amounted to $827.02 million, a marginal decline of 0.4% from the $830.20 million recorded the year prior.
Consequently, earnings per share for the period amounted to $0.776 (2017: $0.779). The twelve month trailing earnings per share is $3.87. The number of shares used in the calculation is 1,066,159,890 units. Notably, PJAM’s stock price closed the trading period on May 15, 2018 at a price of $46.30
Balance Sheet at a glance:
As at March 31, 2018 PanJam Investment Limited (PJAM) had assets totalling $39.18 billion, a 20% increase relative to $32.75 billion a year prior. The growth was attributed to an increase in ‘Investment in associated companies’ and ‘Investment properties’ which amounted to $24.23 billion (2017: $21.80 billion) and $7.91 billion (2017: $5.63 billion) respectively.
Shareholders Equity amounted to $30.82 billion (2017: $26.67 billion) with a book value per share of $28.91 (2017: $25.02).
Disclaimer:
Analyst Certification -The views expressed in this research report accurately reflect the personal views of Mayberry Investments Limited Research Department about those issuer (s) or securities as at the date of this report. Each research analyst (s) also certify that no part of their compensation was, is, or will be, directly or indirectly, related to the specific recommendation (s) or view (s) expressed by that research analyst in this research report.
Company Disclosure -The information contained herein has been obtained from sources believed to be reliable, however its accuracy and completeness cannot be guaranteed. You are hereby notified that any disclosure, copying, distribution or taking any action in reliance on the contents of this information is strictly prohibited and may be unlawful. Mayberry may effect transactions or have positions in securities mentioned herein. In addition, employees of Mayberry may have positions and effect transactions in the securities mentioned herein.


