
Date: July 31, 2018
Paramount Trading (Jamaica) Limited, for the year ended May 31, 2018, recorded a 21% increase in total revenues to $1.39 billion from $1.15 billion reported in 2017. This resulted mainly from a $151.94 million increase in the manufacturing segment which closed at $179.93 million. The chemicals segment, which accounted for 61% of revenue, recorded a 7% decline to close at $847.38 million. Segment operations are as follows:
- Chemicals – $847.38 million, down 7%
- Manufacturing – $179.93 million, up 543%
- Lubricants – $176.64 million, up 144%
- Construction & Adhesives – $151.51 million, up 38%
- Transport – $42.94 million, up 30%
Direct expenses closed the period at $972.05 million, an increase of approximately $170.22 million relative to the $801.82 million booked a year ago. Despite the growth in direct expenses, gross profit grew by approximately 20% to $426.35 million (2017: $354.04 million).
Other operating income amounted $5.74 million for the year, a decline of 51% compared to $11.67 million booked for the previous year’s corresponding period.
Administrative expenses climbed 47% to $323.03 million, up from the $220.28 million recorded for 2017. This resulted mainly from a $52.49 million increase in staff costs to $146.28 million and a $21.4 million increase in depreciation to total $42.32 million. Selling and distribution expenses declined by 15% for the year to close at $29.73 million (2017: $34.78 million).
Finance income amounted to $959,950 down 13% when compared to the $1.11 million reported for the prior year, while finance costs grew 23% to total $13.25 million (2017: $10.74 million).
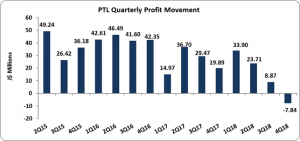
Pre-tax profit for the year totalled $67.04 million, 34% less than the $101 million reported in fourth quarter of 2017. Taxes were charged for the year in the amount of $8.4 million relative to nil in 2017. As such, Net profit attributable to shareholders totalled $58.64 million, a decline of 42% (2017: $101 million).
Earnings per share for the year totalled $0.038 (2017: $0.065), while LPS for the fourth quarter totalled -$0.01. The number of shares used in our calculations is 1,542,467,080 units.
Balance Sheet Highlights:
As at May 31, 2018, the company’s assets totalled $1.23 billion, $207.89 million more than the $1.02 billion quoted a year ago. The main contributor to this growth was the increase in Property Plant and Equipment which closed at $263.59 million relative to $239.97 million a year ago. Inventories as at May 31, 2018 amounted to $500.02 million, a 36% growth relative to the $367.05 million recorded in 2017.
Shareholder’s equity as at May 31, 2018 stood at $740.42 million (2017: $681.78 million) resulting in a book value per share of $0.48 (2017: $0.44).
Disclaimer: Analyst Certification -The views expressed in this research report accurately reflect the personal views of Mayberry Investments Limited Research Department about those issuer (s) or securities as at the date of this report. Each research analyst (s) also certify that no part of their compensation was, is, or will be, directly or indirectly, related to the specific recommendation (s) or view (s) expressed by that research analyst in this research report.
Company Disclosure -The information contained herein has been obtained from sources believed to be reliable, however its accuracy and completeness cannot be guaranteed. You are hereby notified that any disclosure, copying, distribution or taking any action in reliance on the contents of this information is strictly prohibited and may be unlawful. Mayberry may effect transactions or have positions in securities mentioned herein. In addition, employees of Mayberry may have positions and effect transactions in the securities mentioned herein.


