
Date: August 2, 2019
IronRock Insurance Company Limited (ROC), for the six months ended June 30, 2019 posted gross premium of $318.55 million relative $282.12 million; this represents a 13% increase year over year. For the second quarter gross premium rose by 56% to total $197.77 million compared to $127.10 million. According to management, “During the quarter, we generated increased new business revenue, with our Property and Motor classes being the main drivers of the growth.”
Change in gross provision for unearned premiums amounted to $187.28 million compared to $177.23 million in 2018, while excess of loss premium closed the period at $23.74 million (2018: $15.98 million), a 49% jump over the prior year’s corresponding period.
As a result, gross insurance premium revenue amounted to $107.53 million relative to $88.91 million in 2018, a 21% improvement while for the quarter, gross insurance premium revenue rose by 44% to close at $57.68 million (2018: $40.12 million).
Net insurance premium revenue amounted to $101.35 million (2018: $80.40 million) with net unearned premium adjustment of $6.18 million (2018: $8.51 million).
Commission expense totalled $33.50 million in contrast to $27.83 million in 2018, while commission income grew by 5% from $29.27 million to total $30.77 million.
Net Claims grew by 56% from $38.22 million to $59.68 million.
In addition, Operating expenses went up by 4% to $76.62 million (2018: $73.96 million). As such, underwriting loss for the period amounted to $37.68 million relative to a loss of $30.34 million a year earlier. Underwriting loss for the quarter amounted to $20.19 million, up 33% compared to the $15.21 million reported in 2018.
Investment income amounted to $18.01 million relative to $16.08 million in 2018. Foreign exchange gain amounted to $2.84 million versus a gain of $5.66 million in 2018. As a result, the company recorded a loss before taxes of $11.24 million compared to a loss of $8.56 million the prior period.
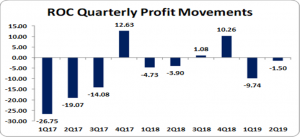
Loss for the period totalled $11.24 million compared to a loss of $8.56 million in 2018, a 31% decline year over year, while Loss for the quarter totalled $1.50 million relative to the loss of $3.90 million for the comparable quarter in 2018, an 62% improvement.
Loss per share for the six months totalled $0.05(LPS 2018: $0.04) while loss per share for the quarter $0.007 (LPS 2017: $0.018). The trailing twelve months loss per share amounted to $0.00043. The stock price as at July 31, 2019 was $4.13. The numbers of shares used in the calculations are 214,000,000.00 units.
Balance Sheet Highlights:
As at June 30, 2019, ROC’s assets totalled $1.11 million (2018: $988.19 million). ‘Investment’ contributed to the increase in the asset base closing the period at $612.41 million (2018: $325.19 million). In addition the Company reported ‘Insurance and other Receivables’ of $163.33 million for the period relative to $112.84 million recorded in 2018. This was however tempered by the reduction in the company’s ‘Short-term Investments’ which amounted to $10 million (2018: $79.26 million) and ‘Securities purchased under resale’ which closed at nil (2018: $80.02 million) at the end of the six months.
Management noted, “Given the important contribution that Investments make to an insurance company’s results, we are pleased with the growth and performance of our Investment Portfolio. From the start of 2019, the annualised Investment Income yield of the portfolio was 6.2% while the annualized Total Return was an impressive 20.0%.”
Shareholder’s equity closed at $536.64 million (2017: $513.80 million) which resulted in a book value per share of $2.51 (2018: $2.40).
Disclaimer: Analyst Certification -The views expressed in this research report accurately reflect the personal views of Mayberry Investments Limited Research Department about those issuer (s) or securities as at the date of this report. Each research analyst (s) also certify that no part of their compensation was, is, or will be, directly or indirectly, related to the specific recommendation (s) or view (s) expressed by that research analyst in this research report.
Company Disclosure -The information contained herein has been obtained from sources believed to be reliable, however its accuracy and completeness cannot be guaranteed. You are hereby notified that any disclosure, copying, distribution or taking any action in reliance on the contents of this information is strictly prohibited and may be unlawful. Mayberry may effect transactions or have positions in securities mentioned herein. In addition, employees of Mayberry may have positions and effect transactions in the securities mentioned herein.


