
May 15, 2025
Regency Petroleum Limited (RPL)
Unaudited financials for the first quarter ended March 31, 2025:
Regency Petroleum Limited (RPL) for the first quarter ended March 31, 2025, reported a 7% increase in operating revenue totaling $434.13 million compared to $404.68 million in the corresponding three months last year.
Year to date, Direct expenses amounted to $362.91 million (2024: $336.18 million), this represents an increase of 8% year over year. Consequently, gross profit increased by 4% to $71.23 million compared to $68.50 million for the first quarter ended March 31, 2024.
Year to date, administrative expenses increased by 45% to close at $47.52 million (2024: $32.82 million), while no selling & distributive expenses were incurred for the three months (2024$: $144,682).
As a result, profit before finance cost for the three months amounted to $24.01 million, a 33% decrease relative to $35.68 million reported in 2024. Finance Costs totaled $8.93 million, a 365% increase from the corresponding period last year. (2024: $1.92 million).
Management noted that the surge in finance costs was attributed to the opening of the latest location, as well as the interest expense tied to lease agreements.
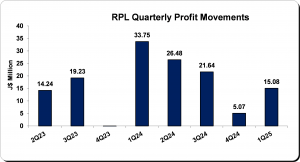
Pretax Profit for the first quarter ended March 31, 2025, amounted to $15.08 million, a 55% decrease relative to $33.76 million reported in 2024.
No tax charge was incurred in the period under review. (2024: nil). Net Profit for the three months amounted to $15.08 million, a 55% decrease from the $33.76 million reported in 2024. Total comprehensive income for the three months ended March 31, 2025 amounted to $8.98 million (2024: $33.76 million).
Consequently, Earnings Per Share for the three months amounted to $0.01 (2024: EPS: $0.02). The twelve-month trailing EPS was $0.05 and the number of shares used in these calculations was 1,435,786,770. Notably, RPL’s stock price closed the trading period on May 14, 2025 at a price of $3.51 with a corresponding P/E ratio of 73.72x.
Balance Sheet Highlights
The company’s assets totaled $1.03 billion (2024: $721.47 million). The movement in total assets was mainly attributable to a $192.07 million increase in ‘Right of use asset’ amounting to $198.12 million (2024: $6.04 million) and an 80% increase in ‘Deferred expenditure’ amounting to $172.83 million (2024: $95.87 million).
Shareholders’ equity was $530.43 million (2024: $468.56 million), representing a book value per share of $0.37 (2024: $0.33).
Disclaimer
Analyst Certification – The views expressed in this research report accurately reflect the personal views of Mayberry Investments Limited Research Department about those issuer (s) or securities as at the date of this report. Each research analyst (s) also certify that no part of their compensation was, is, or will be, directly or indirectly, related to the specific recommendation (s) or view (s) expressed by that research analyst in this research report.
Company Disclosure – The information contained herein has been obtained from sources believed to be reliable, however its accuracy and completeness cannot be guaranteed. You are hereby notified that any disclosure, copying, distribution or taking any action in reliance on the contents of this information is strictly prohibited and may be unlawful. Mayberry may effect transactions or have positions in securities mentioned herein. In addition, employees of Mayberry may have positions and effect transactions in the securities mentioned herein.


