
May 16, 2024
Seprod Limited(SEP)
Seprod Limited (SEP) for the year ended December 31, 2023, reported a 43% increase in Turnover totaling $112.15 billion compared to $78.43 billion in the corresponding period last year. Turnover for the fourth quarter had a 9% increase to close at $30.84 billion compared to $28.23 billion for the comparable quarter of 2022.
The company’s Cost of Sales amounted to $80.78 billion, reflecting a 44% increase year over year. However, the company’s ability to manage costs and generate revenue is evident in the 41% increase in Gross Profit, which reached $31.37 billion compared to $22.31 billion for the year ended December 31, 2022.
Finance & Other Operating Income increased by 7% to close at $1.88 billion (2022: $1.76 billion), while Admin & Other Operating Expenses increased by 35% from $18.05 billion in 2022 to $24.35 billion in the period under review. As a result, operating profit for the year ended December 31, 2023, amounted to $8.70 billion, a 46% increase relative to $5.97 billion reported in 2022.
Finance Costs for the year ended December 31, 2023 had a 80% increase to reach $3.30 billion (2022: $1.84 billion).
Share of Results of associate & joint venture for the year ended December 31, 2023, amounted to $211.09 million, a 98% increase relative to $106.55 million reported in 2022. Share of associate & joint venture results for the fourth quarter amounted to $91.36 million (2022: $85.66 million). Profit Before Taxation totalled $5.61 billion, a 32% increase from last year’s corresponding period. (2022: $4.24 billion).
Taxation for the year ended December 31, 2023, amounted to $992.80 million, a 13% decrease relative to the $1.15 billion reported in 2022. Taxation for the fourth quarter amounted to $57.41 million (2022: $59.87 million).
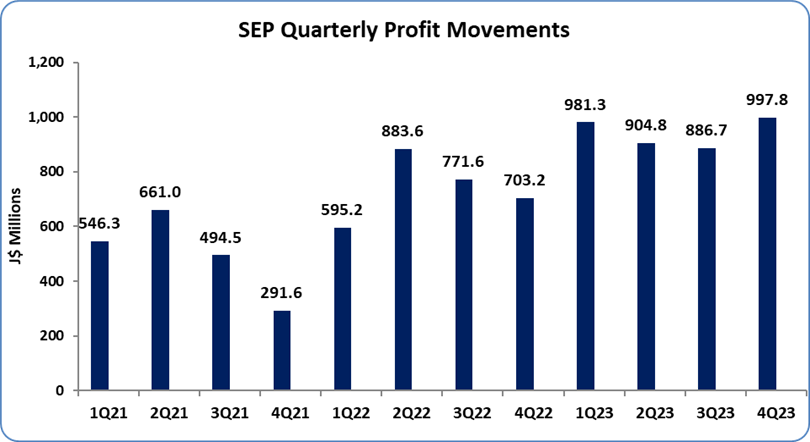
Net Profit from Continuing Operations for the year ended December 31, 2023, increased 49% to $4.61 billion (2022: $3.10 billion). Loss for the period from discontinued operations for the year amounted to $48.98 million, a 73% decrease from the $178.69 million reported in 2022. For the fourth quarter, Loss for the period from discontinued operations was $28.33 million (2022: $716,000). Net profit attributable to shareholders for the year ended December 31, 2023, amounted to $2.93 billion, a 26% increase relative to $2.32 billion reported in 2022. For the fourth quarter, net profit attributable to shareholders was $997.85 million (2022: $703.25 million).
Consequently, Earnings Per Share for the year amounted to $3.93 (2022: EPS: $2.92), while Earnings Per Share for the quarter totaled $1.36 (2022: EPS: $0.96). The number of shares used in these calculations was 733,546,855.
Notably, SEP’s stock price closed the trading period on May 15, 2024 at a price of $83.72 with a corresponding P/E ratio of 21.31x.
Balance Sheet Highlights:
The company’s assets totalled $104.57 billion (2022: $94.50 billion). The total increase in the company’s assets is attributed to an 11% YoY growth of $2.34 billion in Property, plant, and equipment, which closed at $23.12 billion year end (2022: 20.78 billion). The company also saw an astronomical rise in Trade and Other Receivables of $3.17 billion, representing a 16% YoY growth, ending the year at $22.58 billion (2022: $19.41 billion) and Inventories of $1.47 billion, accounting for a 5% YoY growth, ending the year at $28.94 billion (2022: $27.46 billion)
Shareholder’s equity was $28.21 billion (2022: $24.42 billion), representing a book value per share of $38.46 (2022: $33.29). The growth in the company’s shareholders’ equity is attributed to a rise in the company’s Retained earnings that contributed $2.00 billion to total assets and represented a 17% YoY growth, ending the year at $13.54 billion (2022: 11.54 billion) and a 26% YoY growth in the Capital Reserve account of $1.85 billion, closing the period at $8.90 billion (2022: $7.05 billion). Management has made strong returns on capital employed over the last five years at an average of 12%. These reserves will continue to compound and create shareholder value as the company makes strategic acquisitions, increases spending in CAPEX for efficiencies across the group, and continues growth in exports.
Disclaimer:
Analyst Certification – The views expressed in this research report accurately reflect the personal views of Mayberry Investments Limited Research Department about those issuer (s) or securities as at the date of this report. Each research analyst (s) also certify that no part of their compensation was, is, or will be, directly or indirectly, related to the specific recommendation (s) or view (s) expressed by that research analyst in this research report.
Company Disclosure – The information contained herein has been obtained from sources believed to be reliable, however its accuracy and completeness cannot be guaranteed. You are hereby notified that any disclosure, copying, distribution or taking any action in reliance on the contents of this information is strictly prohibited and may be unlawful. Mayberry may effect transactions or have positions in securities mentioned herein. In addition, employees of Mayberry may have positions and effect transactions in the securities mentioned herein.


