
May 20, 2025
Seprod Limited (SEP)
Unaudited Financials for the First Quarter Ended March 31, 2025:
Seprod Limited (SEP) reported a 32% increase in revenue for the first quarter ended March 31, 2025, totaling $37.69 billion, compared to $28.59 billion in the corresponding three months of the previous year.
Cost of Sales amounted to $27.62 billion (2024: $21.10 billion), representing a 31% year-over-year increase. Consequently, gross profit rose by 34% to $10.07 billion, compared to $7.49 billion for the first quarter ended March 31, 2024.
Finance & Other Operating Income decreased by 46%, closing at $118.99 million (2024: $219.19 million), while Administrative and Other Operating Expenses increased by 47%, from $5.31 billion in 2024 to $7.80 billion for the three-month period. As a result, Operating Profit for the first quarter amounted to $2.39 billion (2024: $2.40 billion).
Finance Costs for the first quarter ended March 31, 2025, totaled $1.15 billion, a 45% increase compared to $795.06 million reported in 2024.
Share of Results of Associate & Joint Venture for the three months amounted to $119.55 million, a 15% decrease compared to $141.25 million reported in 2024. Profit Before Taxation totaled $1.36 billion, a 22% decrease from the corresponding period last year (2024: $1.74 billion).
Taxation for the first quarter ended March 31, 2025, amounted to $490.82 million, a 5% decrease compared to $514.10 million reported in 2024.
Net Profit from Continuing Operations for the three months declined by 29% to $867.47 million (2024: $1.23 billion). Net Loss from Discontinued Operations for the period amounted to $17.55 million, a 28% decrease from the $24.39 million reported in 2024.
Net Profit for the period amounted to $849.92 million, a 29% decrease from the $1.20 billion reported in the corresponding period of 2024.
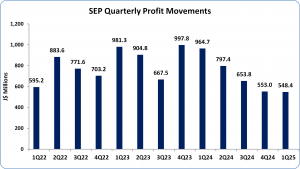
Net Profit Attributable to Shareholders for the first quarter ended March 31, 2025, was $548.40 million, a 43% decrease compared to $964.73 million reported in 2024.
Consequently, Earnings Per Share (EPS) for the three months amounted to $0.75 (2024: EPS: $1.32). The twelve-month trailing EPS was $3.00, based on 733,546,855 shares used in the calculation.
Notably, SEP’s stock price closed the trading period on May 19, 2025, at $83.92, with a corresponding P/E ratio of 28.01x.
Balance Sheet Highlights
The company’s total assets amounted to $133.40 billion (2024: $103.15 billion). This increase was primarily attributable to receivables, which totaled $32.94 billion (2024: $23.57 billion).
Shareholders’ equity stood at $30.17 billion (2024: $28.68 billion), representing a book value per share of $41.13 (2024: $39.10).
Disclaimer:
Analyst Certification – The views expressed in this research report accurately reflect the personal views of Mayberry Investments Limited Research Department about those issuer (s) or securities as at the date of this report. Each research analyst (s) also certify that no part of their compensation was, is, or will be, directly or indirectly, related to the specific recommendation (s) or view (s) expressed by that research analyst in this research report.
Company Disclosure – The information contained herein has been obtained from sources believed to be reliable, however its accuracy and completeness cannot be guaranteed. You are hereby notified that any disclosure, copying, distribution or taking any action in reliance on the contents of this information is strictly prohibited and may be unlawful. Mayberry may effect transactions or have positions in securities mentioned herein. In addition, employees of Mayberry may have positions and effect transactions in the securities mentioned herein.


