
November 24, 2025
Seprod Limited (SEP)
Unaudited financials for the nine months ended September 30, 2025
Seprod Limited (SEP) reported a 21% increase in Turnover, totalling $113.05 billion for the nine months ended September 30, 2025, compared to $93.43 billion in the corresponding period of 2024. Turnover for the third quarter rose by 8%, closing at $37.87 billion versus $35.10 billion for the comparable quarter last year.
Cost of Sales amounted to $82.93 billion (2024: $68.71 billion), representing a 21% year-over-year increase. Consequently, Gross Profit increased by 22% to $30.12 billion, up from $24.72 billion for the nine months ended September 30, 2024. For the third quarter, the company recorded Gross Profit of $9.91 billion, marginally above the $9.80 billion reported for Q3 2024.
Finance & Other Operating Income increased by 89%, closing at $1.79 billion (2024: $949.36 million). Other Operating Expenses rose by 31%, moving from $18.59 billion in 2024 to $24.27 billion in the period under review. As a result, Operating Profit for the nine months ended September 30, 2025, totalled $7.64 billion, reflecting an 8% increase relative to $7.08 billion reported in 2024. Operating Profit for the third quarter amounted to $3.04 billion, up from $2.39 billion in 2024.
Share of Results from Associates and Joint Ventures amounted to $254.53 million for the nine-month period, a 13% decline from $292.52 million in 2024. For the third quarter, this totalled $67.41 million compared to $72.47 million in the prior year. Profit Before Taxation amounted to $4.21 billion, a 5% decrease relative to $4.44 billion recorded in 2024. Profit Before Taxation for the quarter was $1.82 billion (2024: $1.28 billion).
The taxation charge for the nine months amounted to $1.10 billion, a 21% decrease from $1.40 billion reported in 2024. For the third quarter, taxation charge totalled $179.43 million (2024: $436.07 million).
Net Profit from Continuing Operations increased by 3%, amounting to $3.11 billion (2024: $3.03 billion) for the nine months. For the quarter, Net Profit from Continuing Operations was $1.64 billion, significantly above the $846.34 million reported in 2024.
Profit for the period from Discontinued Operations totalled $52.71 million for the nine months, a 12% decrease from $59.83 million in 2024. For the third quarter, this amounted to $25.88 million (2024: $18.68 million).
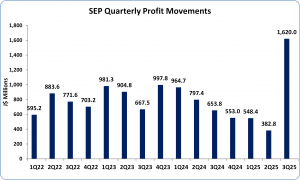
Net Profit for the nine-month period amounted to $3.06 billion, a 3% increase relative to $2.97 billion in 2024. For the third quarter, Net Profit totalled $1.62 billion, significantly higher than $827.65 million reported in 2024.
Net Profit attributable to shareholders for the nine-month period amounted to $2.55 billion, a 6% increase relative to $2.42 billion in 2024. For the third quarter, Net Profit attributable to shareholders totalled $1.62 billion, significantly higher than $653.84 million reported in 2024.
Finance Costs for the nine months ended September 30, 2025, rose by 25% to $3.68 billion (2024: $2.94 billion).
Earnings Per Share (EPS) for the nine months amounted to $3.22 (2024: $3.29), while EPS for the third quarter was $1.78 (2024: $0.89). The EPS calculations were based on the net profit attributable to stockholders of the Company, using a weighted average of 910.9 million ordinary stock units for the quarter and 792.6 million for the nine-month period (2024: 733.5 million).
Notably, SEP’s stock price closed trading on November 24, 2025, at $81.78, corresponding to a P/E ratio of 21.82x.
Balance Sheet Highlights
Total Assets amounted to $138.32 billion (2024: $121.32 billion), driven primarily by an increase in receivables, which totalled $36.03 billion (2024: $28.75 billion).
Shareholders’ Equity increased to $37.55 billion (2024: $29.74 billion), resulting in a Book Value per Share of $51.19 (2024: $40.54).
Disclaimer:
Analyst Certification – The views expressed in this research report accurately reflect the personal views of Mayberry Investments Limited Research Department about those issuer (s) or securities as at the date of this report. Each research analyst (s) also certify that no part of their compensation was, is, or will be, directly or indirectly, related to the specific recommendation (s) or view (s) expressed by that research analyst in this research report.
Company Disclosure – The information contained herein has been obtained from sources believed to be reliable, however its accuracy and completeness cannot be guaranteed. You are hereby notified that any disclosure, copying, distribution or taking any action in reliance on the contents of this information is strictly prohibited and may be unlawful. Mayberry may effect transactions or have positions in securities mentioned herein. In addition, employees of Mayberry may have positions and effect transactions in the securities mentioned herein.


