
June 7, 2024
Scotia Group Jamaica Limited (SGJ) for the six months ended April 30, 2024, reported a 20% increase in Interest income totalling $23.31 billion compared to $19.37 billion in the corresponding period last year. Interest income for the second quarter had an 18% increase to close at $11.71 billion compared to $9.93 billion for the comparable quarter of 2023.
Interest expense amounted to $957.97 million (2023: $500.01 million), this represents an increase of 92% year over year. Consequently, net interest income increased by 18% to $22.35 billion compared to $18.87 billion for the six months ended April 30, 2023. The company booked net interest income of $11.25 billion for the second quarter versus $9.56 billion reported for the similar quarter of 2023.
SGJ noted, “Total revenues excluding expected credit losses for the six months ended April 30, 2024, grew by $3.5 billion to $30.5 billion reflecting an increase of 13.0% over the prior year period. This was primarily driven by an increase in net interest income of $3.5 billion stemming from the strong growth in our loan portfolio, higher gains on foreign currency activities as well as higher fee and commission income”.
Expected credit losses jumped 73% to close at $2.03 billion (2023: $1.18 billion), while net interest income impairment losses on loans increased by 15% from $17.69 billion in 2023 to $20.32 billion in the period under review.
Net insurance revenue for the six-month period was $1.054 billion, up 2% YoY, while for the second quarter net insurance revenue went up by 8%.
Total operating income for the six months amounted to $28.47 billion, a 10% increase relative to $25.82 billion reported in 2023. Total operating income for the second quarter amounted to $14.58 billion (2023: $12.58 billion).
Total operating expenses totalled $15.46 billion, a 7% increase from the corresponding period last year. (2023: $14.44 billion). SGJ noted the increase was driven by “higher asset taxes associated with the year over year growth in the asset base, higher billings associated with deposit processing arising from an increase in transaction volumes and annual inflationary increases”.
Profit before taxation for the six months amounted to $13.01 billion, a 14% increase relative to $11.38 billion reported in 2023. Profit before taxation for the second quarter amounted to $7.80 billion (2023: $6.01 billion).
Taxation for the six months had a 15% increase to reach $4.47 billion (2023: $3.89 billion).
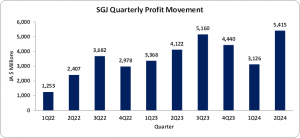
Net Profit attributable to shareholders for the six months amounted to $8.54 billion, a 14% increase from the $7.49 billion reported in 2023. For the second quarter, Net Profit attributable to shareholders was $5.42 billion (2023: $4.12 billion).
Consequently, Earnings per share for the six months amounted to $2.74 (2023: EPS: $2.41), while Earnings per share for the quarter totaled $1.74 (2023: EPS: $1.32). The twelve-month trailing EPS was $5.87, and the number of shares used in these calculations was 3,111,572,984.
Notably, SGJ’s stock price closed the trading period on June 6, 2024, at a price of $44.41 with a corresponding P/E ratio of 7.56x.
Balance Sheet Highlights
The company’s assets totalled $676.51 billion (2023: $630.27 billion). The increase was mainly due to a 14% rise in ‘loans net of allowances for credit losses’ closing at $282.28 billion. SGJ highlighted, “our core loan book continues to perform well with mortgages increasing year over year by 24%, consumer loans by 13%, credit cards by 15% and commercial loans by 8%”.
Shareholder’s equity was $126.82 billion (2023: $108.13 billion), representing a book value per share of $40.76 (2023: $34.75).
Disclaimer:
Analyst Certification -The views expressed in this research report accurately reflect the personal views of Mayberry Investments Limited Research Department about those issuer (s) or securities as at the date of this report. Each research analyst (s) also certify that no part of their compensation was, is, or will be, directly or indirectly, related to the specific recommendation (s) or view (s) expressed by that research analyst in this research report.
Company Disclosure -The information contained herein has been obtained from sources believed to be reliable, however its accuracy and completeness cannot be guaranteed. You are hereby notified that any disclosure, copying, distribution or taking any action in reliance on the contents of this information is strictly prohibited and may be unlawful. Mayberry may effect transactions or have positions in securities mentioned herein. In addition, employees of Mayberry may have positions and effect transactions in the securities mentioned herein.


")

