
April 13, 2022
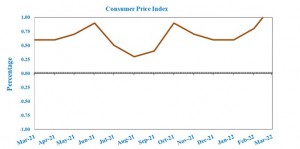
The Consumer Price Index for All Urban Consumers (CPI-U) rose 1.2% for March 2022, on a seasonally adjusted basis, according to U.S. Bureau of Labour Statistics (BLS) after a 0.8% increase in February. The all-items index rose 8.5% before seasonal adjustment over the last year to an index level of 287.504 (1982-84=100).
The all-items less food and energy index climbed 0.3% in March 2022 compared to January 2022 0.5% increase. Notably, “The shelter index was by far the biggest factor in the increase, with a broad set of indexes also contributing, including those for recreation, household furnishings and operations, medical care, and motor vehicle insurance.” The all-items less food and energy index increased 6.5% over last 12 months with virtually all of its major component indexes rising over the span.
The index shelter accounts for nearly two thirds of the all-items less food and energy monthly increase, it rose by 0.5% in March. The rent index increased 0.4% in March, as did the owners’ equivalent rent index, while there was a 3.3% increase in lodging away from home. The index for household furnishings and operations also continued to rise month over month by 1%. The index for motor vehicle insurance rose 0.7% and the index for personal care rose 0.5%. Other indexes such as airline fares (+10.7%), recreation (+0.2%) and apparel (+0.6%). While the medical care index increased 0.5% due to a 0.5% rise in physicians’ services, 0.4% in hospital and offset by a 0.2% decline in prescription. Furthermore, the index for new vehicles increased 0.2% in March, while used cars and trucks fell 3.8% and communication declined 0.5%.
The index for food rose 1.0% in March, after a 0.1% increase in February. The index for food at home increased 1.5%, while the index for food away from home rose 0.3% in March. Over the last 12 months, the index for food at home and food away from home increased 10% and 6.9%, respectively.
Furthermore, Under the index for food at home, all six major store food group indexes increased in March, fruits and vegetables (+1.5%), meats, poultry, fish and eggs (+1.0%), cereals and bakery products (+1.5%), dairy and related products (+1.2) and non -alcoholic beverages (+1.2).
The food away from home 0.3% increase was mainly due to the index for full-service meals which rose 0.7% in contrast to the index for limited-service meals which declined 0.2%, its first decrease since October 2018.
Over the last 12 months all six indexes for food at home increase, notably, “the index for meats, poultry, fish, and eggs increased 13.7% over the last year as the index for beef rose 16%. The other major grocery store food group indexes also rose over the past year, with increases ranging from 7% (dairy and related products) to 10.3% (other food at home),” according to the Bureau of Labor Statistics. Furthermore, “the index for full-service meals rose 8% over the last 12 months, and the index for limited-service meals rose 7.2%. The index for food at employee sites and schools, in contrast, declined 30.5% over the past 12 months, reflecting widespread free lunch programs,” in relation to the index for food away from home.
The index for energy increased 11% in March, after a 3.5% increase in February. This movement was due to a sharp 18.3% increase the gasoline index. Meanwhile, the index for natural gas increased 0.6% whereas the electricity index increased 2.2% in March.
The energy index rose 32% over the past 12 months with all major energy component indexes increasing. This increase was due to the gasoline index’s increase of 48% over the last 12 months, while natural gas and electricity rose 21.6% and 11.1%, respectively.
Disclaimer:
Analyst Certification -The views expressed in this research report accurately reflect the personal views of Mayberry Investments Limited Research Department about those issuer (s) or securities as at the date of this report. Each research analyst (s) also certify that no part of their compensation was, is, or will be, directly or indirectly, related to the specific recommendation (s) or view (s) expressed by that research analyst in this research report.
Company Disclosure -The information contained herein has been obtained from sources believed to be reliable, however its accuracy and completeness cannot be guaranteed. You are hereby notified that any disclosure, copying, distribution or taking any action in reliance on the contents of this information is strictly prohibited and may be unlawful. Mayberry may effect transactions or have positions in securities mentioned herein. In addition, employees of Mayberry may have positions and effect transactions in the securities mentioned herein


