
May 3, 2024
According to the U.S. Bureau of Labor Statistics, total nonfarm payroll employment increased by 175,000 in April, while the unemployment rate remained relatively stable at 3.9 percent. Noteworthy job gains were observed particularly in sectors such as health care, social assistance, transportation, and warehousing. The U.S. Bureau of Labor Statistics reported these findings based on two monthly surveys: the household survey, which assesses labor force status, including unemployment by demographic characteristics, and the establishment survey, which measures nonfarm employment, hours, and earnings by industry.
Household Survey Data
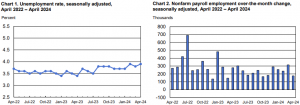
In April, the U.S. unemployment rate held steady at 3.9%, with minimal change in the number of unemployed individuals, which stood at 6.5 million. This stability has persisted since August 2023, with the rate fluctuating between 3.7% and 3.9%. Among different demographic groups, adult men saw a slight increase in unemployment, while the rate for Blacks decreased, offsetting a prior month’s increase. Jobless rates for adult women, teenagers, Whites, Asians, and Hispanics remained largely unchanged. The number of long-term unemployed individuals, at 1.3 million, remained essentially the same, accounting for 19.6% of all unemployed. Additionally, the labour force participation rate and employment-population ratio showed little variation over the month and year, holding at 62.7% and 60.2%, respectively.
In April, the number of individuals employed part-time for economic reasons remained steady at 4.5 million, reflecting those who desired full-time employment but were constrained to working part-time due to reduced hours or the inability to secure full-time positions. Similarly, the count of individuals not in the labour force but actively seeking employment, totalling 5.6 million, saw minimal change. These individuals were not classified as unemployed because they weren’t actively seeking work in the past four weeks or were unavailable to take on a job. Among this group, the number of marginally attached individuals, comprising those willing and available to work but not actively seeking employment in the preceding month, remained relatively constant at 1.6 million. This group included discouraged workers, numbering 362,000, who believed no suitable jobs were available for them, indicating little change in their situation over the month.
Establishment Survey Data
In April, nonfarm payroll employment in the U.S. increased by 175,000 jobs, marking a slight decline from the average monthly gain of 242,000 over the previous 12 months. Job growth was notable in health care, adding 56,000 jobs, primarily in ambulatory health care services, hospitals, and nursing and residential care facilities. Social assistance saw an increase of 31,000 jobs, driven by gains in individual and family services. Transportation and warehousing sectors added 22,000 jobs, particularly in couriers, messengers, and warehousing and storage. Retail trade continued its upward trend with 20,000 new jobs, while construction employment remained relatively stable after a notable increase in March. Government employment saw minimal change, especially in local government. Other major industries, including manufacturing, wholesale trade, and leisure and hospitality, showed little change in employment levels for the month.
In April, there was a slight increase in average hourly earnings for all employees on private nonfarm payrolls, rising by 7 cents or 0.2 percent to $34.75. Over the past year, average hourly earnings have seen a significant uptick, growing by 3.9 percent. Similarly, average hourly earnings for private-sector production and nonsupervisory employees increased by 6 cents or 0.2 percent to $29.83. However, the average workweek for all employees on private nonfarm payrolls dipped slightly by 0.1 hour to 34.3 hours, with manufacturing workweek remaining unchanged at 40.0 hours. Overtime hours in manufacturing also held steady at 2.9 hours. For production and nonsupervisory employees, the average workweek decreased by 0.1 hour to 33.7 hours.
Revisions to the nonfarm payroll employment data for February and March revealed a downward adjustment of 34,000 jobs for February, now reported at +236,000, while March saw an upward revision of 12,000 jobs, revised to +315,000. Consequently, the combined employment for the two months is 22,000 lower than initially reported. These revisions are typical as they stem from additional reports received from businesses and government agencies since the last published estimates, along with recalculations of seasonal factors.
Disclaimer:
Analyst Certification – The views expressed in this research report accurately reflect the personal views of Mayberry Investments Limited Research Department about those issuer (s) or securities as at the date of this report. Each research analyst (s) also certify that no part of their compensation was, is, or will be, directly or indirectly, related to the specific recommendation(s) or view (s) expressed by that research analyst in this research report.
Company Disclosure – The information contained herein has been obtained from sources believed to be reliable, however its accuracy and completeness cannot be guaranteed. You are hereby notified that any disclosure, copying, distribution or taking any action in reliance on the contents of this information is strictly prohibited and may be unlawful. Mayberry may effect transactions or have positions in securities mentioned herein. In addition, employees of Mayberry may have positions and effect transactions in the securities mentioned herein.


