Net Interest Income declined by 6% or $44.51 million when compared with the same period a year ago, to total $683.48 million. This as interest income fell by 7% to close at $1.37 billion (2016: $1.46 billion) while interest expenses decreased by 7% to close the period at $682.73 million (2016: $733.97). For the second quarter Net interest income amounted to $332.27 million down 8.7% from the $365.23 million reported in 2016.
Net Fees and Commission Income amounted to $663.33 million, an 11% increase from $598.83 million last year. Net Foreign Exchange Trading Income totaled $8.76 million, a decrease of 47% from the $16.58 million booked in 2016.
‘Gains on financial assets classified as held for trading’ totaled $183.45 million, a decline of 10% from the $202.95 million booked in 2016. Scotia Investments also gained $10.94 million from other revenue, a decline of 33% million relative to $16.21 million posted in 2016. As a result, Total Operating Income declined year over year by 2% to total $1.55 billion (2016:$1.58 billion). For the second quarter Total Operating Income reported was $795.70 million down 6% from 2016 (2016: 849.74 million).
Total Operating Expenses for the period decreased to $889.19 million, down 3% when compared to $912.99 million in the corresponding period last year. The largest contributor to expenses, ‘Salaries and Staff Benefits’ fell 2% to close at $424.25 million (2016: $432.53 million), while Other Operating Expenses down 9% to close at $252.35 million (2016; 277.38 million). The company booked Asset Tax of $141.17 million compared to $136.18 million reported for the comparable period in 2016. Property Expenses for the first six months reflected a 6% increase to $53.26 million (2016: $50.02 million).
Consequently, Profit before Taxation totaled $662.77 million (2016: $666.30 million), while tax charges for the period was $221.46 million, relative to $209.20 million.
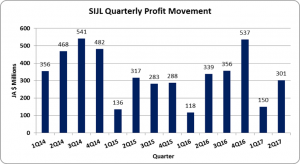
As such, Net profit attributable to shareholders totaled $451.32 million down 1% from the $457.10 million booked in 2016. Net Profit for the quarter was $301.47 million (2016: 339.26 million).
Earnings per share (EPS) for the six months totaled $1.07 (2016: $1.08) while EPS for the quarter closed at $0.71 (2016: $0.80). The twelve month trailing EPS is $3.18. The number of shares used in the calculation was 423,194,765 units.
Balance Sheet Highlights:
As at April 30, 2017, the company’s assets totaled $66.97 billion, $1.65 billion less than the $68.63 billion reported a year ago. Total liabilities were $36.64 billion compared to $40 billion in 2016.
The company ended the period with Shareholders’ Equity amounting to $15.11 billion. This resulted in a book value per share of $35.71 (2016:$34.11.)
Disclaimer:
Analyst Certification -This research report is for information purposes only and should not be construed as a recommendation. Each research analyst (s) also certify that no part of their compensation was, is, or will be, directly or indirectly, related to the specific recommendation (s) or view (s) expressed by that research analyst in this research report.
Company Disclosure -The information contained herein has been obtained from sources believed to be reliable, however its accuracy and completeness cannot be guaranteed. You are hereby notified that any disclosure, copying, distribution or taking any action in reliance on the contents of this information is strictly prohibited and may be unlawful. Mayberry may effect transactions or have positions in securities mentioned herein. In addition, employees of Mayberry may have positions and effect transactions in the securities mentioned herein.


