CAC 2000 Limited (CAC)
Results for the Third Quarter ended June 30, 2017:
- Revenues for the third quarter increased by 17% to $231.67 million, compared to $197.52 million for the same period the prior financial year. CAC revenues for the nine months increased 18% to $799.18 million relative to $678.84 million for the comparable period in 2016. Cost of Sales also increased, by 23% to close at $522.70 for the period (2016: $423.36 million). Consequently, Gross Profit improved by 8% to $276.48 million (2016: $255.47 million), while for the quarter, CAC booked gross profit of $73.15 million (2016: $73.50).
- For the quarter the company saw a 13% decline in Total Expenses to close at $70.57 million (2016:$81.37 million). For the nine months ended June 2017 there was a 4% increase in Total Expenses to $217.44 million (2016: $209.32 million). This was as a result of a 20% upward movement in Selling & Distribution Expenses to $26.10 million (2016: $21.72 million) as well as a 2% increase in General Administration to $191.34 million (2016: $187.60 million). According to the company “increase in selling and distribution expenses is due to increased sales commissions, advertising and warranty expenses. The increase in administrative expenses is due to increased legal and professional fees and office costs (supplies and utilities).”
- There was a $1.97 million increase in in Other Income to $2.12 million from $140,837 reported for the same period the prior year due to tax credits booked. Consequently, once Other Income and Total Expenses are considered, Profit before Taxation and Finance Cost grew by 32% to $61.16 million (2016: $46.30 million).
- Net Finance Costs has increased significantly for the period in review to $11.37 million (2016: $4.38 million). This was as a result of reduction in cash by lawsuit payout and also a reduction in interest income.
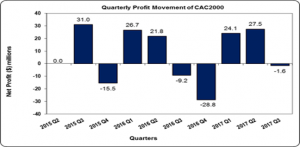
- Profit Before Taxation increased by 19% for the nine months and closed at $49.79 million (2016: $41.91 million). There was a tax credit of $222,812 compared to a tax charge of $2.64 million in the same 2016 period. For the nine months the company booked a 27% increase in Net Profit to $50.01 million (2016: $39.28 million). The company reported a Net Loss for the quarter of $1.64 million (2016: $9.20 million).
- Earnings-per-share (EPS) for the nine months totaled $0.39 compared to $0.30 in 2016, while the loss per share for the quarter amounted to $0.01 relative to a loss of $0.07 in 2016. The twelve months trailing EPS amounted to $0.16. The number of shares used in our calculations is 129,032,258 units.
- According to the company “Our initial phase of the customer relationship management system was implemented and we have managed to negotiate improved supplier credit concessions. These along with our healthy portfolio of open jobs and recently added human resources, puts us in a position for a strong final quarter”.
Balance Sheet Highlights:
- As at June 30, 2017, the Company reported total assets of $832.54 million, a $60.57 million increase when compared to $771.97 million a year ago. This was as a result of a 69% increase in Trade and Receivables to $415.17 million. Cash and Cash Equivalents declined 38% to $91.93 million (2016: $147.35 million). Shareholders’ Equity as at June 30, 2017 was $372.37 million compared to $351.16 million a year ago. This resulted in a book value per share of $2.89 compared to $2.72 in 2016.