
Date: October 12, 2018
Caribbean Cream Ltd. (KREMI) for six months ended August 31, 2018 reported a 19% increase in revenue totalling $799.51 million compared to $673.26 million in the corresponding period last year. Revenue for the second quarter rose 9% to close at $387.76 million compared to $354.17 million for the comparable quarter of 2016.
Costs of Sales amounted to $515.52 million (2017: $453.14 million), an increase of 14%, “due to increase in the foreign exchange and higher utility costs” management indicated. Nevertheless, Gross Profit rose 29% or $63.86 million to $283.99 million compared to $220.12 million for the period ended August 31, 2017. The company booked gross profit of $137.39 million for the second quarter versus $112.77 million reported for the similar quarter of 2017.
Administrative Expenses climbed 27% to close at $158.75 million (2017: $125.43 million), while Selling and Distribution Costs rose by 28% from $21.42 million to $27.48 million. Management indicated “The Company continues to strengthen its focus on New Product Research and Development whilst also preparing itself to becoming HACCP compliant” Consequently, operating profit for the six months period amounted to $98.91 million, up 33% relative to $74.42 million book in 2017.
Finance Cost fell 2% year over year to amount to $6.14 million relative to $6.26 million recorded for the first six month of 2017. Interest income for the period also reflected a decline from $2.34 million to $1.50 million for the six months.
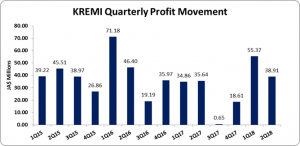
No taxes were charged for the period, as such Net Profit Attributable to Shareholders increased by 34% from $70.49 million in 2017 to $94.28 million. Profit for the quarter amounted to $38.91 million (2017: $35.64 million), up 9% year over year. Consequently, Earnings per Share for the period amounted to $0.25 (2017: $0.19), while the EPS for the quarter totaled $0.10 (2017: $0.09). The trailing twelve months earnings per share amounted to $0.30. The number of shares used in these calculations were 378,568,115 units.
Balance Sheet Highlights:
The company’s assets totaled $981.11 million (2017: $830.33 million), $46.17 million more than its value as at August 2017. The increase in assets was largely due to an increase of $136.19 million in ‘Property, Plant and Equipment to a total of $614.33 million (2017: $478.14 million). Inventory also increased by 9% to close the year at $125.23 million compared to the $118.30 reported in the previous year. Cash and Cash Equivalents however also increase over the past twelve month to $188.57 million (2017: $175.46 million). Management noted, “The Company’s cash position remains strong as it continues along its capital investment programme with the addition of $119 million for property, plant and equipment.”
Shareholders’ equity was $731.77 million (201: $640.94 million), representing a book value per share of $1.93 (2017: $1.69).
Disclaimer:
Analyst Certification -The views expressed in this research report accurately reflect the personal views of Mayberry Investments Limited Research Department about those issuer (s) or securities as at the date of this report. Each research analyst (s) also certify that no part of their compensation was, is, or will be, directly or indirectly, related to the specific recommendation (s) or view (s) expressed by that research analyst in this research report.
Company Disclosure -The information contained herein has been obtained from sources believed to be reliable, however its accuracy and completeness cannot be guaranteed. You are hereby notified that any disclosure, copying, distribution or taking any action in reliance on the contents of this information is strictly prohibited and may be unlawful. Mayberry may effect transactions or have positions in securities mentioned herein. In addition, employees of Mayberry may have positions and effect transactions in the securities mentioned herein.

