
April 19, 2018
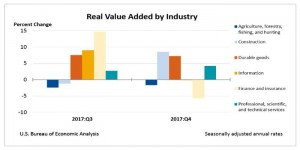
U.S real gross domestic product (GDP) grew 2.9% for the fourth quarter of 2017, led by 16 of the 22 domestic industry groups. According to gross domestic product (GDP) by industry statistics released by the Bureau of Economic Analysis, “Durable Goods Manufacturing; Construction; and Professional, Scientific, and Technical Services were the leading contributors to the increase in U.S. economic growth in the fourth quarter of 2017.”
For the Durable Goods Manufacturing industry group, real value added, a measure of an industry’s contribution to GDP, increased 7.2% in the fourth quarter. The growth recorded was at a slower pace than the 7.5% growth reported in the third quarter of 2017. However, the fourth quarter growth primarily reflected increases in motor vehicles, bodies and trailers, and parts; computer and electronic products; and fabricated metal products.
Construction had its largest increase since the first quarter of 2016, expanding by 8.5% for the fourth quarter subsequent to a decline by 1.2% in third quarter.
Professional, scientific, and technical services increased 4.2%, after increasing 2.7%. The fourth quarter growth primarily reflected an increase in miscellaneous professional, scientific, and technical services, which includes accounting and tax preparation services, and scientific research and development services.
Finance and insurance decreased 5.7% in the fourth quarter, after increasing 14.7% in the third quarter. The decrease was primarily attributed to a decrease in Federal Reserve banks, credit intermediation, and related activities, as well as a decrease in securities, commodity contracts, and investments.
Information services decreased 0.2%, after an increase of 9.0%. This decrease was primarily attributed to broadcasting and telecommunications.
Agriculture, forestry, fishing, and hunting fell 1.7%, after decreasing 2.4%.
The information contained herein has been obtained from sources believed to be reliable, however its accuracy and completeness cannot be guaranteed. You are hereby notified that any disclosure, copying, distribution or taking any Action in reliance on the contents of this information is strictly prohibited and may be unlawful. Mayberry may effect transactions or have positions in securities mentioned herein. In addition, employees of Mayberry may have positions and effect transactions in the securities mentioned herein.


