
May 9, 2022
Fontana Limited (FTNA) for the nine months ended March 31, 2022, recorded an 21% increase in revenues to total $4.68 billion compared to $3.88 billion for the same period in 2021. The Company’s revenue for the third quarter rose 24% to $1.52 billion (2021: $1.22 billion).
Cost of Sales for the period increased 23% to closed at $3.01 billion, up from $2.45 billion reported the prior year’s comparable period, while for the third quarter there was a 25% uptick to $1.01 billion (2021: $806.79 million).
As such, gross profit for the nine months amounted to $1.66 billion, a 16% uptick when compared to $1.43 billion recorded last year. However, gross profit for the third quarter rose 21% from $416.36 million booked in the third quarter of 2021 to $503.01 million for the corresponding period in 2022.
Fontana’s administrative expenses rose by 14% for the period, to total $1.06 billion versus $926.27 million in 2021, while selling and promotion closed the nine months at $49.89 million (2021: $40.95 million).
As such, operating profit experienced a 19% increase to $556.48 million relative to $465.98 million booked in the same period last year. Operating profit for the third quarter closed at $132.62 million (2021: $95.39 million).
Other income for the nine months amounted to $49.94 million (2021: $43.70 million). As for the third quarter under review, other income closed at $17.74 million versus other income of $15.22 million booked in 2021’s third quarter.
Finance cost year to date totalled $191.88 million, an increase of 34% when compared to the $142.97 million recorded for the same period last year. While for the quarter finance cost amounted to $45.78 million (2021: $37.71 million), a 21% increase. Management stated that “Finance costs were impacted primarily by the IFRS 16 lease assessment as an additional long-term lease was added in this financial year. The finance costs associated with the bond issued in December 2021 also impacted the total finance cost.”
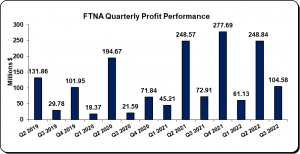
This resulted in profit before taxation totalling $414.54 million compared to $366.70 million recorded last year, a 13% year over year increase. For the quarter profit before taxation moved from $72.91 million in 2021 to $104.58 million in 2022, surge of 43% year over year.
There were no income taxes for the period under review, as such, net profit increased by 13% to close the period under review at $414.54 million relative to $366.70 million recorded the prior corresponding period. Net profit for the quarter amounted to $104.58 million compared to $72.91 million booked for the prior quarter of 2021.
Earnings per share (EPS) for the period totalled $0.33 (2021: $0.29). EPS for the third quarter amounted to $0.08 (2021: $0.06). The twelve months trailing earnings per share amounted to $0.45. The number of shares used in our calculations amounted to 1,249,374,825 units. FTNA’s stock price closed the trading period on May 6, 2022, at $10.77 with a corresponding P/E of 24.02 times.
Balance Sheet at a glance:
As at March 31, 2022, total assets amounted to $4.46 billion, up $1.01 billion from $3.45 billion as at the previous year. The increase in total assets was as a result of the increase in ‘Inventories’ and ‘Cash and Cash equivalents’ which closed the period with $1.06 billion (2021: $808.96 million) and $1.34 billion (2021: $809.39 million), respectively. Management advised that “As we begin our preparations for the expansion in Kingston and St. Catherine, our cash on hand remains favorable at $1.34 billion, an increase of 65.5% over last year.”
Shareholders’ Equity of $2.09 billion was reported (2021: $1.76 billion) which resulted in a book value per share of $1.68 (2021: $1.41).
Disclaimer:
Analyst Certification -The views expressed in this research report accurately reflect the personal views of Mayberry Investments Limited Research Department about those issuer (s) or securities as at the date of this report. Each research analyst (s) also certify that no part of their compensation was, is, or will be, directly or indirectly, related to the specific recommendation (s) or view (s) expressed by that research analyst in this research report.
Company Disclosure -The information contained herein has been obtained from sources believed to be reliable, however its accuracy and completeness cannot be guaranteed. You are hereby notified that any disclosure, copying, distribution or taking any action in reliance on the contents of this information is strictly prohibited and may be unlawful. Mayberry may effect transactions or have positions in securities mentioned herein. In addition, employees of Mayberry may have positions and effect transactions in the securities mentioned herein.

