
August 5, 2026
LASCO Manufacturing Limited (LASM)
Unaudited financials for the first quarter ended June 30, 2026:
LASCO Manufacturing Limited (LASM) for the first quarter ended June 30, 2026 reported a 7% increase in revenue totaling $3.13 billion compared to $2.92 billion in the corresponding three months last year.
Year to date, cost of sales amounted to $1.91 billion (2025: $1.80 billion), this represents an increase of 6% year over year. Consequently, gross profit increased by 9% to $1.22 billion compared to $1.12 billion for the first quarter ended June 30, 2025.
Other Operating Income increased by 2% to close at $104.07 million (2025: $101.86 million), while operating expenses increased by 16% from $382.89 million in 2025 to $443.45 million for the three months. As a result, Operating Profit for the first quarter amounted to $885.31 million, a 5% increase compared to $841.62 million reported in 2025.
Finance Cost for the three months amounted to $19.11 million, a 1,099% increase relative to $1.59 million reported in 2025. Profit before Tax totaled $866.21 million, a 3% increase from the corresponding period last year (2025: $840.03 million).
The tax charge incurred for the first quarter ended June 30, 2026, amounted to $192.10 million, a 13% decrease relative to $221.69 million reported in 2025.
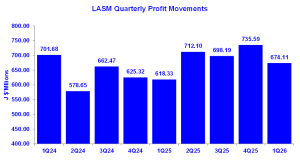
Net Profit for the three months had a 9% increase to reach $674.11 million (2025: $618.33 million). Unrealised gains on financial instruments for the three months amounted to $11.99 million, compared to a loss of $17.14 million reported in 2025.
As a result, Total comprehensive income for the three months increased by 14% to reach $686.10 million (2025: $601.19 million).
Consequently, Earnings Per Share for the three months amounted to $0.16 (2025: EPS: $0.15). The twelve-month trailing EPS was $0.68 and the number of shares used in these calculations was 4,147,913,151. Notably, LASM’s stock price closed the trading period on August 5, 2026 at a price of $7.47 with a corresponding P/E ratio of 10.97x.
Balance Sheet Highlights
The company’s assets totaled $21.92 billion (2025: $19.75 billion). The movement in total assets was mainly attributable to a 17% increase in “Property, Plant & Equipment” to $5.17 billion (2025: $4.43 billion), a $704.80 million increase in “Short term Investments” to $5.34 billion (2025: $4.64 billion) and a 21% increase in “Cash and Bank Balances” to $3.76 billion (2025: $3.11 billion). Additionally, “Inventories” increased by 19% amounting to $2.94 billion (2025: $2.47 billion); these gains were partly offset by a 12% decline in “Trade and Other Receivables” to $3.63 billion (2025: $4.12 billion).
Shareholder’s equity was $17.56 billion (2025: $15.54 billion), representing a book value per share of $4.23 (2025: $3.75).
Disclaimer:
Analyst Certification – The views expressed in this research report accurately reflect the personal views of Mayberry Investments Limited Research Department about those issuer (s) or securities as at the date of this report. Each research analyst (s) also certify that no part of their compensation was, is, or will be, directly or indirectly, related to the specific recommendation(s) or view (s) expressed by that research analyst in this research report.
Company Disclosure – The information contained herein has been obtained from sources believed to be reliable, however its accuracy and completeness cannot be guaranteed. You are hereby notified that any disclosure, copying, distribution or taking any action in reliance on the contents of this information is strictly prohibited and may be unlawful. Mayberry may effect transactions or have positions in securities mentioned herein. In addition, employees of Mayberry may have positions and effect transactions in the securities mentioned herein.