
March 3, 2026
GraceKennedy Group Ltd(GK)
Audited financials for the twelve months ended December 31, 2025:
GraceKennedy Group Ltd (GK), for the year ended December 31, 2025, reported a 6% increase in Revenues, totalling $177.79 billion compared to $167.04 billion for the corresponding period in 2024.
Direct and operating expenses amounted to $172.16 billion (2024: $158.55 billion), reflecting an 9% year‑over‑year increase. Net impairment losses on financial assets totalled $837.93 million (2024: $503.52 million). Consequently, Profit before Other Income declined to $4.80 billion, compared to $7.99 billion for the year ended December 31, 2024.
Other Income increased by 19%, closing at $5.39 billion (2024: $4.54 billion). As such, Profit from Operations amounted to $10.19 billion, relative to $12.53 billion reported in 2024.
Interest income – non‑financial services rose 6% to $915.83 million (2024: $863.33 million), while interest expense – non‑financial services increased 4% to $2.03 billion, up from $1.95 billion in 2024.
Share of Results of Associates & Joint Ventures for FY2025 totalled $1.21 billion, representing a 34% increase relative to the $899.95 million reported in 2024.
Profit Before Taxation amounted to $10.29 billion, compared to $12.34 billion for the prior year.
Taxation for the year ended December 31, 2025, amounted to $3.04 billion, relative to $3.48 billion reported in 2024. As such, Net Profit for FY2025 was $7.25 billion, representing an 18% decline compared to the $8.86 billion reported in 2024.
Net Profit Attributable to Shareholders amounted to $6.89 billion, down 18% from the $8.41 billion reported in 2024.
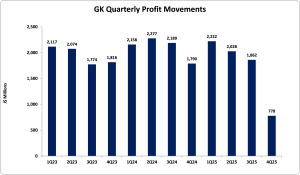
Consequently, Earnings Per Share for the twelve months amounted to $6.97 (2024: EPS: $8.51), while Loss Per Share for the quarter totaled $0.79 (2024: EPS: $1.81). The twelve-month trailing EPS was $6.97, and the number of shares used in these calculations was 988,883,729.
Notably, GK’s stock price closed the trading period on March 02, 2026, at a price of $71.44 with a corresponding P/E ratio of 10.25x.
Balance Sheet Highlights
The company’s assets totaled $266.59 billion (2024: $236.64 billion). The growth in total assets was mainly due to increases in cash and deposits, loans receivable, and receivables. Cash and deposits rose by J$10.51 billion or 45% year-over-year (J$33.69 billion vs J$23.19 billion), loans receivable increased by J$6.33 billion or 14% to J$51.02 billion (2024: J$44.69 billion) and receivables climbed by J$8.86 billion or 43% to J$29.27 billion (2024: J$20.41 billion).
Shareholders’ equity was $92.87 billion (2024: $86.98 billion), representing a book value per share of $93.31 (2024: $87.39).
Disclaimer:
Analyst Certification – The views expressed in this research report accurately reflect the personal views of Mayberry Investments Limited Research Department about those issuer (s) or securities as at the date of this report. Each research analyst (s) also certify that no part of their compensation was, is, or will be, directly or indirectly, related to the specific recommendation (s) or view (s) expressed by that research analyst in this research report.
Company Disclosure – The information contained herein has been obtained from sources believed to be reliable, however its accuracy and completeness cannot be guaranteed. You are hereby notified that any disclosure, copying, distribution or taking any action in reliance on the contents of this information is strictly prohibited and may be unlawful. Mayberry may affect transactions or have positions in securities mentioned herein. In addition, employees of Mayberry may have positions and effect transactions in the securities mentioned herein.


