For the three months ended March 31, 2017,GraceKennedy Limited (GK) reported total revenue of $23.69 billion for period (2016: $22.13 billion), a year over year increase of 7%. The biggest contributor to the group’s overall revenue for the first quarter was income from the ‘Food Trading’ segment which contributed a total of $18.82 billion (2016: $17.82 billion), an increase of 6% relative to the prior year’s corresponding period. Management noted, “this segment showed growth in revenue, primarily due to higher sales from our Jamaican foods distribution and supermarket business when compared to the corresponding period of 2016.” Notably, GraceKennedy Foods (USA) LLC the distribution company in the United States continues to see expansion in chain stores, while Grace Foods Latin America & Caribbean (GF LACA) showed strong performance in both revenues and profit for the quarter.
o Among the other segments contributing to revenue, ‘Banking & Investments’ increased 13% to total $1.54 billion. GK indicated, “First Global Bank (FGB) saw growth in both its loan portfolio and non-interest income. The bank announced the planned opening of a new branch in Portmore, Jamaica.” The new location is part a the integrated retail strategy which entails the new branch being located in the newly renovated Hi-Lo, location in Portmore.
o Revenue from ‘Insurance’ amounted to $1.36 billion, an increase of 9%, while ‘Money Services’ brought in $1.97 billion, 16% more than the $1.69 billion reported in March 2016. This was due in part to increased transaction volumes in the remittance business. GK stated, “through GK MPay customers are able to pay for goods and services and receive remittances via their mobile devices. We have been at the forefront of creating avenues for financial inclusion and GK MPay will help to provide more Jamaicans with more convenient access to affordable financial services.”
Total Expenses amounted to $22.77 billion relative to $21.12 billion booked for the comparable period in 2016, a 8% growth. Other Income declined 54% to total $456.52 million (FY2016: $991.60 million). GK indicated, “included in other income for the prior year is a gain on the disposal of investments of $606.47 million. a significant portion of this amount related to a non-recurring gain realised on the liquidation of certain non-operating subsidiaries in 2016.” As such, ‘Profit from Operations’ amounted to $1.38 billion, a 31% decline year over year from $2 billion booked in March 2016.
Interest income from non-financial services rose 5% to total $94.44 million compared to $89.77 million reported a year earlier. Interest expenses from non-financial services amounted to $163.67 million versus $182.13 million in the first quarter of 2016, a 10% reduction.
Share of results of associated companies increased by 3% amounting to $259.20 million, compared to $251.07 million reported for March 2016.
Pre-tax profits decreased 27% to approximately $1.57 billion, compared to pre-tax profit of $2.16 billion documented for the first quarter of 2016. GK incurred taxation expenses amounting to approximately $422.76 million compared to $560.49 million in March 2016. Consequently, net profit decreased by 28% to $1.14 billion from $1.60 billion booked for the first three months of 2016. GK noted, “as previously reported, a non-recurring gain was realised on the liquidation of some non-operating subsidiaries for the corresponding period of 2016, without this, net profit for the current period would have been marginally lower than the corresponding period of 2016 by 2.4%”
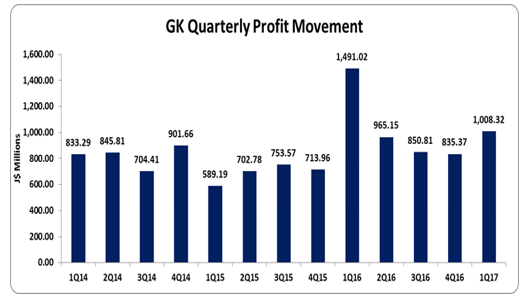
Net Profits attributable to shareholders amounted to $1.01 billion compared to $1.49 billion a year earlier, showing a 32% decline. Earnings per share for first quarter amounted to $1.01 (2016: $1.50). The number of shares used in our calculations is 994,886,892 units.
Balance Sheet Highlights:
As at March 31, 2017 the company’s assets totalled $126.79 billion, 12% or $13.95 billion more than its value a year ago. The improvement resulted in part from a growth in ‘Pledged Assets’ by $6.46 billion. Pledged assets as at March 31, 2017 amounted to $15.21 billion (2016: $8.75 billion).
Shareholders’ equity amounted to $43.86 billion which compares to equity of $39.12 billion as at March 31, 2016. As a result, book value per share amounted to $44.08 (2016: $39.32).
Disclaimer:
Analyst Certification -This research report is for information purposes only and should not be construed as a recommendation. Each research analyst (s) also certify that no part of their compensation was, is, or will be, directly or indirectly, related to the specific recommendation (s) or view (s) expressed by that research analyst in this research report.
Company Disclosure -The information contained herein has been obtained from sources believed to be reliable, however its accuracy and completeness cannot be guaranteed. You are hereby notified that any disclosure, copying, distribution or taking any action in reliance on the contents of this information is strictly prohibited and may be unlawful. Mayberry may effect transactions or have positions in securities mentioned herein. In addition, employees of Mayberry may have positions and effect transactions in the securities mentioned herein.


