
Date: April 30, 2019
Caribbean Cream Limited (KREMI), audited results for the year ended February 28, 2019, reported a 13% increase in revenue totalling $1.55 billion compared to $1.37 billion in the corresponding period last year. Revenue for the fourth quarter rose 6% to close at $405.17 million compared to $381.04 million for the comparable quarter of the prior financial year.
Costs of Sales for the period amounted to $1.03 billion (2017: $952.95 million), an increase of 8%. This translated to gross profit increasing 24% or $99.21 million to close at $519.54 million compared to $420.33 million for the period ended February 28, 2018. The company booked gross profit of $129.22 million for the fourth quarter versus $114.88 million reported for the similar quarter of 2018.
Administrative Expenses climbed 26% to close at $345.95 million (2017: $275.03 million), while Selling and Distribution Costs rose by 24% from $46.64 million to close the year at $57.92 million. Consequently, operating profit for the year amounted to $118.01 million, up 17% relative to $100.90 million book in the prior year.
Finance Cost rose 17% year over year to $17.89 million relative to $15.26 million recorded for the comparable period in 2018. Interest income for the period reflected a 39% decline from $4.12 million to $2.52 million for year end.
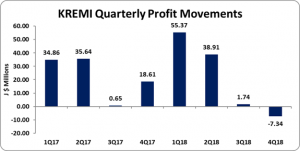
Taxes of $13.97 million were charged for the period, as such net profit attributable to shareholders had a marginal decline of 1% from $89.75 million in 2018 to $88.68 million. However, the company incurred losses for the quarter of $7.34 million in contrast to a $18.61 million recorded in the previous financial year. Consequently, Earnings per Share (EPS) for the period amounted to $0.23 (2017: $0.24), while the LPS for the quarter totalled $0.019 relative to an EPS of $0.049 twelve months earlier. The numbers of shares used in these calculations were 378,568,115 units. KREMI’s stock price close the trading period on April 29, 2019 at a price of $5.50.
Balance Sheet Highlights:
The company’s assets totalled $1.04 billion (2018: $848.03 million), $194.44 million more than its value as at February 28, 2018. The increase in assets was largely due to an increase of $190.83 million in ‘property, plant and equipment to a total of $705.45 million (2018: $514.63 million). ‘Inventory’ rose by $47.73 million in 2019 when compared to $92.71 million in 2018. On the other hand, ‘Cash and Cash Equivalents’ declined as at February 28, 2019 to close as $129.99 million in 2018: $174.73 million). Management noted, “the company continues its capital investment programme with the addition of $244 million for property plant and equipment.”
Shareholders’ equity amounted to $707.83 million (2018: $637.49 million), representing a book value per share of $1.87 (2018: $1.68).
Analyst Certification -The views expressed in this research report accurately reflect the personal views of Mayberry Investments Limited Research Department about those issuer (s) or securities as at the date of this report. Each research analyst (s) also certify that no part of their compensation was, is, or will be, directly or indirectly, related to the specific recommendation (s) or view (s) expressed by that research analyst in this research report.
Company Disclosure -The information contained herein has been obtained from sources believed to be reliable, however its accuracy and completeness cannot be guaranteed. You are hereby notified that any disclosure, copying, distribution or taking any action in reliance on the contents of this information is strictly prohibited and may be unlawful. Mayberry may effect transactions or have positions in securities mentioned herein. In addition, employees of Mayberry may have positions and effect transactions in the securities mentioned herein.


