June 2, 2020
Consumer Price Index – April 2020
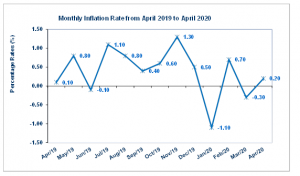
The consumer price index for April 2020 was 103.7 resulting in an inflation rate of 0.2% increase when compared to previous month’s 103.5 price index, according to the Statistical Institute of Jamaica (STATIN). STATIN noted, “the inflation rate for April 2020 was impacted by the reduction in the GCT rate from 16.5% to 15.0% with effect from April 1, 2020.” As a result, ‘Food and Non- Alcoholic Beverages’, the heaviest weighted division booked 0.3% increase in its index. While, the division of ‘Housing, Water and Electricity’, recorded a rate of 0.2% due to a 3.1% increase in ‘Water Supply and Miscellaneous Services Relating to the Dwelling’. However, the overall movement in the index was offset by a decrease of 0.5% in the index for the ’Transport’ division, due mainly to decline in petrol prices. Inflation within the Greater Kingston Metropolitan Area, Rural Areas and Other Urban Centres each recorded an inflation rate of 0.2% for April 2020.
The index for the ‘Food and Non-Alcoholic Beverages’ division recorded a 0.3% increase in its index for April 2020. Within the index, the ‘Food’ group recorded a 0.3% increase in its index due to the 1.3% increase in both ‘Meat and other parts of slaughtered land animals’ and ‘Fish and Seafood’. Additionally, there was an increase of 0.7% in ‘Cereals and cereal products’ and 0.2% for ‘Milk, other dairy products and eggs’. However, the movement was tempered by a decline in the ‘Vegetables & Tubers’ by 1.2% and ‘Fruits and Nuts’ by 0.9%. STATIN noted, “A glut in the market for ground provisions and vegetables resulted in lower prices.” In addition, the ‘Non-Alcoholic Beverages’ group went up by 0.5% with the classes ‘Coffee, Tea and Cocoa’ and ‘Fruits and Vegetable Juices’ each registering a 0.7% growth in its index. While, ‘Water, Soft drinks and Other Non-alcoholic Beverages’ rose by 0.3% when compared to March 2020.
The division for ‘Clothing and Footwear’ observed an increase of 0.5% in its index for April 2020. In the index the group ‘Clothing’ registered growth of 0.5% and ‘Footwear’ climbed 0.6% for April 2020.
The index for the ‘Housing, Water, Electricity, Gas and Other Fuels’ division recorded a 0.2% increase in its index for April 2020. The lower rates for electricity caused a 0.5% decline in the index for the group ‘Electricity, Gas and Other Fuels’. Moreover, there were higher water and sewage rates in April 2020 which contributed to an increase of 3.1% in the index for ‘Water Supply and Miscellaneous Services Related to the Dwelling’ as stated by STATIN.
The division for ‘Health’ recorded an increase of 0.3% in its index for April 2020. This resulted mainly from the ‘Medicines and Health Products’ and ‘Out Patient Care Services’ groups which posted increases of 0.3% each. However, this movement was tempered by a 0.2% decline in ‘Other Health Services.’
The index for the division ‘Transport’ decreased by 0.5% in April 202. The main contributors to this decrease were as a result of a decline registered for ‘Operation of Personal Transport Equipment’ and ‘Purchases of vehicles’ which fell by 1.9% and 0.2%, respectively. On the other hand, the index for ‘Transport Services of Good’ recorded a 0.1% increase for the month of April.
The ‘Restaurants and Accommodation Services’ division registered a 0.1% rise for April 2020 due to increase in ‘Accommodation Services’ by 0.8%, as a result of a depreciation in the exchange rate. Lastly, the division for ‘Personal Care, Social Protection and Miscellaneous Goods and Services’ produced an increase of 0.2% for April 2020 which was a result of the upward movements of the index for the ‘Other appliances, articles and products personal care’ group within the division.
The movement in the index for the calendar year to date inflation was 1.7%. Individual divisions saw the following changes:
- Food and Non-Alcoholic Beverages: (0.3%)
- Alcoholic Beverages and Tobacco: (0.0%)
- Clothing and Footwear: (0.5%)
- Housing, Water, Electricity, Gas and Other Fuels: (0.2%)
- Furnishing, Household Equipment and Routine Household Maintenance: (0.0%)
- Health: (0.3%)
- Transport: (-0.5%)
- Information and Communication: (-0.1%)
- Recreation, Sport and Culture: (0.3%)
- Education: (0.0%)
- Restaurants and Accommodation Services: (0.1%)
- Personal Care, Social Protection and Miscellaneous Goods and Services: (0.2%)
Disclaimer:
Analyst Certification -The views expressed in this research report accurately reflect the personal views of Mayberry Investments Limited Research Department about those issuer (s) or securities as at the date of this report. Each research analyst (s) also certify that no part of their compensation was, is, or will be, directly or indirectly, related to the specific recommendation (s) or view (s) expressed by that research analyst in this research report.
Company Disclosure -The information contained herein has been obtained from sources believed to be reliable, however its accuracy and completeness cannot be guaranteed. You are hereby notified that any disclosure, copying, distribution or taking any action in reliance on the contents of this information is strictly prohibited and may be unlawful. Mayberry may effect transactions or have positions in securities mentioned herein. In addition, employees of Mayberry may have positions and effect transactions in the securities mentioned herein.


