
October 20, 2020
Consumer Price Index – September 2020
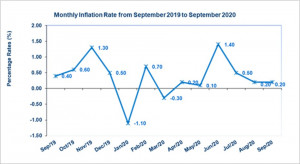
The consumer price index for September 2020 was 106.1 resulting in an inflation rate of 0.2%, an increase when compared to the previous month’s 105.9 price index, according to the Statistical Institute of Jamaica (STATIN). Notably, STATIN indicated that the main contributors to this increase were: ‘Education’ which booked a 22.4% increase in its index due to higher tuition fee for the new school year. ‘Recreation, Sport and Culture’ and ‘Personal Care, Social Protection and Miscellaneous Goods and Services’ which both moved up by 0.5%. STATIN highlighted increases in other divisions such as ‘Clothing and Footwear’ and ‘Furnishings, Household Equipment and Routine Household Maintenance’, which increased by 0.4% and 0.6% respectively. Also, the ‘Alcoholic Beverages, Tobacco and Narcotics’ division index rose by 0.3%, while, ‘Restaurants and Accommodation Services’ division increased by 0.2% and ‘Health’ division climbed by 0.3%. The Greater Kingston Metropolitan Area and Other Urban Centres each recorded an inflation rate of 0.5% and 0.6% respectively, while Rural Areas reported deflation of 0.2% for the September 2020 period.
The heaviest weighted division of ‘Food and Non-Alcoholic Beverages’ recorded a negligible movement for September 2020. The ‘Food’ group index also recorded a negligible movement, in which movement in the index for the group ‘Cereals and cereal products’ went up by 1% attributed to an increase in bread and bakery products. The index for the class ‘Meat and other parts of slaughtered land animals’ rose by 2.1% as a result of an increase in the price of chicken. STATIN noted, “the inflation rate in the ‘Food’ group was moderated by the fall in the prices for agricultural produce such as carrot, lettuce, yam and potatoes resulting in a 2.8% decrease in the index class ‘Vegetables, tubers, plantains, cooking bananas and pulses’.” Whereas, the ‘Non-Alcoholic Beverages’ group registered an increase of 0.3%.
The ‘Alcoholic Beverages, Tobacco and Narcotics’ division advanced by 0.3% for September 2020, due to a 0.4% increase in the index for the class ‘Beer’. While the division for ‘Clothing and Footwear’ observed an increase of 0.4% in its index for September 2020. In the index, the group ‘Clothing’ registered growth of 0.4% and ‘Footwear’ climbed by 0.3%.
The index for the ‘Housing, Water, Electricity, Gas and Other Fuels’ division recorded a 2.2% decrease in its index for September 2020. This was as a result of a 20.7% fall in the index for the group ‘Water Supply and Miscellaneous Services Related to the Dwelling,’ due to decreased water and sewage rates. This was however moderated by an increase in electricity rates as reflected in the class ‘Electricity, Gas and Other Fuels’ which booked a 1.9% increase in its index.
There was a 0.6% increase in the index for ‘Furnishings, Household Equipment and Routine Household Maintenance.’ This was mainly due to the 0.5% rise in the index for the group ‘Goods and Services for Routine Household Maintenance.’ STATIN noted that this was, “as a result of increased prices for some household non-durable items such as laundry soap, detergents and other cleaning products. All other groups in the division registered increases in their index notably: ‘Furniture, Furnishing and Loose Carpets’ 1.1% ; ‘Household Textiles’ 0.9% and ‘Household Appliances’ 0.8%.”
The division for ‘Health’ recorded an increase of 0.3% in its index for September 2020. This resulted mainly from the ‘Medicines and Health Products’ and ‘Out Patient Care Services’ groups which both increased by 0.2% and 0.7%, respectively. Notably, the increase in ‘Medicines and Health Products’ was driven by increased in prices for over-the-counter and prescription drugs. Moreover, the ‘Other Health Services’ group observed a 0.5% increase.
The index for the division ‘Transport’ declined by 0.1%. According to STATIN this was largely due to, “lower petrol prices.” In addition, the ‘Information and Communication’ group recorded a 0.1% increase in its index for September 2020 which was attributable to higher prices for some information processing equipment.
The ‘Recreation, Sport and Culture’ division registered a 0.5% rise for September 2020. The main factors which contributed to this movement were the groups ‘Newspapers, Books and Stationery’ and ‘Garden Products and Pets’ which increased of 0.6% and 0.5%, respectively. The upward trend was due to higher prices for books, stationery and drawing materials for the former group, while the rise in pet food costs was the key factor for the latter group.
The ‘Education’ division recorded an increase of 22.4% in its index, mainly attributable to the rise in the cost of tuition fees for the start of the new school year 2020-2021, at the pre-primary and primary education level. These increases were mainly associated with the removal of discounts which were applied during the previous term.
There was a 0.2% increase in the index for the ‘Restaurant and Accommodation Services’ division for September 2020. The group ‘Food and Beverage Serving Services’ rose by 0.1%, due mainly to higher costs for meals consumed away from home. The removal of discounted rates for hotels resulted in a 10.2% increase in the index for the group ‘Accommodation Services.’
Lastly, the division for ‘Personal Care, Social Protection and Miscellaneous Goods and Services’ produced an increase of 0.5% for September 2020, which was a result of the upward movement in the index for the group ‘Personal Care’ by 0.6%.
The movement in the index for calendar year to date inflation was 3.6%, fiscal year-to-date was 2.3% and the point- to-point was 4.9%. Individual divisions saw the following changes:
- Food and Non-Alcoholic Beverages: (0.0%)
- Alcoholic Beverages and Tobacco: (0.3%)
- Clothing and Footwear: (0.4%)
- Housing, Water, Electricity, Gas and Other Fuels: (-2.2%)
- Furnishing, Household Equipment and Routine Household Maintenance: (0.6%)
- Health: (0.3%)
- Transport: (-0.1%)
- Information and Communication: (0.1%)
- Recreation, Sport and Culture: (0.5%)
- Education: (22.4%)
- Restaurants and Accommodation Services: (0.2%)
- Insurance and Financial Services (0.0%)
- Personal Care, Social Protection and Miscellaneous Goods and Services: (0.5%)
Disclaimer:
Analyst Certification -The views expressed in this research report accurately reflect the personal views of Mayberry Investments Limited Research Department about those issuer (s) or securities as at the date of this report. Each research analyst (s) also certify that no part of their compensation was, is, or will be, directly or indirectly, related to the specific recommendation(s) or view (s) expressed by that research analyst in this research report.
Company Disclosure -The information contained herein has been obtained from sources believed to be reliable, however its accuracy and completeness cannot be guaranteed. You are hereby notified that any disclosure, copying, distribution or taking any action in reliance on the contents of this information is strictly prohibited and may be unlawful. Mayberry may effect transactions or have positions in securities mentioned herein. In addition, employees of Mayberry may have positions and effect transactions in the securities mentioned herein.


