
September 4, 2019
Goods and Services Trade Deficit
The U.S. Census Bureau and the U.S. Bureau of Economic Analysis indicated that, “the goods and services deficit was $54.0 billion in July, down $1.5 billion from $55.5 billion in June.”
July exports ($207.4 billion), were more than June exports by $1.2 billion, whereas, July imports were $261.4 billion which was $0.4 billion less than June imports.
For the period under review compared with that of 2018, there was an 8.2% increase in the goods and services deficit increased. Moreover, exports decreased $3.4 billion or 0.2%. Imports increased $24.9 billion or 1.4%.
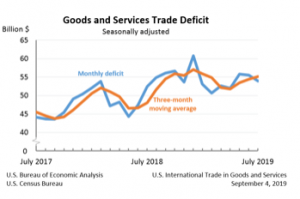
Three-Month Moving Averages
For the three months ended in July, the average goods and services deficit increased $0.7 billion to $55.1 billion. This was due to a $0.5 billion increase in average exports $208.0 billion in July and a $1.2 billion increase in average imports to $263.1 billion in July.
In relation to export of goods, these consists of consumer goods capital goods automotive vehicles, parts and engines which all increased by $1.5 billion, $0.8 billion and $0.6 billion, respectively. While, industrial supplies and materials decreased by $1.7 billion. Additionally, export of services decreased by $0.1 billion.
As for imports of goods; industrial supplies and materials increased $0.9 billion and capital goods decreased $1.5 billion. However, imports of services increased by $0.1 billion.
Analyst Certification -The views expressed in this research report accurately reflect the personal views of Mayberry Investments Limited Research Department about those issuer (s) or securities as at the date of this report. Each research analyst (s) also certify that no part of their compensation was, is, or will be, directly or indirectly, related to the specific recommendation (s) or view (s) expressed by that research analyst in this research report.
Company Disclosure -The information contained herein has been obtained from sources believed to be reliable, however its accuracy and completeness cannot be guaranteed. You are hereby notified that any disclosure, copying, distribution or taking any action in reliance on the contents of this information is strictly prohibited and may be unlawful. Mayberry may effect transactions or have positions in securities mentioned herein. In addition, employees of Mayberry may have positions and effect transactions in the securities mentioned herein.


