
Date: September 16, 2019
CAC 2000 (CAC) revenues for the nine months ended July 31, 2019 decreased 19% to $737.69 million relative to $908.81 million for the comparable period in 2018. Revenues for the third quarter decreased by 22% to $221.21 million compared to $285.38 million for the same period the prior financial year.
Cost of Sales also decreased by 10% for the period to $498.50 million (2018: $556.01 million). Consequently, Gross Profit for the period fell $113.61 million or 32% to $239.19 million (2018: $352.80 million). For the quarter, Gross Profit dropped 37% to close at $65.54 million (2018: $103.64 million). Management noted that, “this was primarily due to reduced revenues and reduction in margins realized.”
The Company reported a 8% increase in Total Expenses to $306.70 million (2018: $284.39 million). This was as a result of a 13% increase in General Administration to $290.93 million (2018: $257.19 million), but tempered by a 42% downward movement in Selling & Distribution Expenses to $15.77 million (2018: $27.20 million). For the quarter, the Company reported a 15% increase in Total Expenses which closed at $102.54 million compared to $88.89 million in 2018. The Company stated that, “improved efficiencies have resulted in a reduction in selling, distribution and general administrative expenses despite increased warehousing (rental and transportation), plus utility costs that CAC have incurred to try and minimize the negative impacts of the construction.”
Other Income of $47.20 million was recorded for the period up from $7.33 million reported for the same period the prior year. CAC highlighted that, “this continues to be positively impacted by the Barbuda project and the Company plans to continue this trend by exploring further expansion within the territory.” Consequently, loss before taxation and finance cost closed at $20.31 million versus profit before taxation and finance cost of $75.74 million in the previous comparable period.
Net finance costs increased significantly for the period in review to $19.16 million (2018: $3.26 million). “Finance costs have increased due to increased borrowing to cover the Company’s working capital shortfalls (Due to reduction in walk-in cash sales),” Management noted. Interest expense for the nine months amounted to $17.56 million relative to $16.62 million twelve months earlier. Interest income and other losses amounted to $206,761 (2018: $4.85 million) and $1.80 million (2018: gains of $8.51 million) respectively.
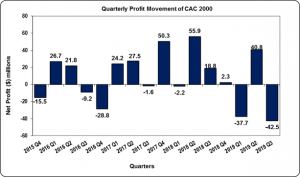
Loss before taxation closed the nine months period at $39.47 million relative to profit before taxation of $72.48 million reported in the prior corresponding period. No taxes were recorded for the period as such, net loss for the nine months amounted to $39.47 million compared to net profit of $72.48 million in the same period last year. Net loss for the quarter was reported at $42.54 million compared to a profit of $18.83 million for the corresponding quarter of 2018.
Loss-per-share (LPS) for the nine months amounted to $0.31 compared to earnings per share of $0.56 in 2018, while for the quarter the LPS amounted to $0.33 versus a earnings per share of $0.15. The twelve months trailing LPS amounted to $0.29. The number of shares used in our calculations is 129,032,258 units. Notably, CAC’s stock price closed the trading period on September 13, 2019 at a price of $15.00.
Balance Sheet Highlights:
As at July 31, 2019, the Company reported total assets of $1.11 billion, a 1% decline when compared to $1.12 billion a year ago. This was as a result ‘Inventories’ which decreased 10% to $320.02 million (2018: $356.89 million) and ‘Trade and Other Receivables’ which fell 11% to $521.72 million (2018: $583.03 million). This movement was however tempered by an upward movement in ‘Cash and Bank Deposits’ which went up 30% to $148.92 million (2018: $114.79 million).
Shareholders’ Equity as at July 31, 2019 was $443.55 million compared to $485.25 million a year ago. This resulted in a book value per share of $3.44 compared to $3.76 in 2018.
Analyst Certification -The views expressed in this research report accurately reflect the personal views of Mayberry Investments Limited Research Department about those issuer (s) or securities as at the date of this report. Each research analyst (s) also certify that no part of their compensation was, is, or will be, directly or indirectly, related to the specific recommendation (s) or view (s) expressed by that research analyst in this research report.
Company Disclosure -The information contained herein has been obtained from sources believed to be reliable, however its accuracy and completeness cannot be guaranteed. You are hereby notified that any disclosure, copying, distribution or taking any action in reliance on the contents of this information is strictly prohibited and may be unlawful. Mayberry may effect transactions or have positions in securities mentioned herein. In addition, employees of Mayberry may have positions and effect transactions in the securities mentioned herein.


