
May 16, 2018
Derrimon Trading Limited (DTL) grew its Trading Income by 27%, to end the quarter at $1.94 billion compared to the $1.53 billion for the first quarter of 2018.
Cost of Sales increased by 27%% to $1.59billion for the period (2017: $1.25 billion). As a result, Gross Profit amounted to $353.48 million relative to $278.63 million the year prior, an increase of 27%. Other Income increased by 25% to close the period at $6.73 million.
Total operating expenses was $264.27 million for the period, representing an increase of 21% on the $218.11 million recorded in the prior year. Administrative expense totalled $229.82million, a 23% increase when compared to the $186.81 million in 2017. DTL reported a 10% increase in selling and distribution costs to close the quarter at $34.45 million (2017: $31.30 million).
First quarter operating profit posted a 46% growth to $95.94 million in contrast to $65.90 million booked a year earlier.
Finance Cost increased by 56% to total $38.37million for the period relative to $24.62 million in 2017.
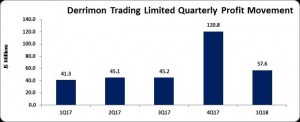
Consequently, profit before taxation grew by 39% ending the period at $57.57million for the quarter compared to $41.28 million in 2017. No taxes was reported for the period as such Net Profit amounted to $57.57million (2017: $41.27 million).
Total comprehensive income total $51.60 million versus $241.97 million reported a year earlier. The disparity is as a result of $206.35 million (2017: nil) booked for ‘increase in revaluation investment’.
Earnings per share closed the period at $0.21 (2017: $0.15). The twelve month trailing EPS amounted to $0.98. The total number of shares used in the computation amounted to 273,336,067 units. As at May 15, DTL stock was trading at $9.00.
Balance Sheet Highlight
As at March 31, 2018, the company’s assets totalled $2.67 billion, $17.30 million more than its value as at March 31, 2017 of $2.65 billion. The upward movement in the asset base was due to upward movement in fixed assets (49%), investment (74%), and cash & bank (44%). However the overall movement was tempered by a downward movement in inventory by 22% to 824.01 million from to a total of $1.06 billion, posted in 2017.
Shareholder Equity totalled $1.04 billion (2017: $886.93 million) which translated to a book value of $3.82 per share (2017: $3.24).
Disclaimer:
Analyst Certification -This research report is for information purposes only and should not be construed as a recommendation. Each research analyst (s) also certify that no part of their compensation was, is, or will be, directly or indirectly, related to the specific recommendation (s) or view (s) expressed by that research analyst in this research report.
Company Disclosure -The information contained herein has been obtained from sources believed to be reliable, however its accuracy and completeness cannot be guaranteed. You are hereby notified that any disclosure, copying, distribution or taking any action in reliance on the contents of this information is strictly prohibited and may be unlawful. Mayberry may effect transactions or have positions in securities mentioned herein. In addition, employees of Mayberry may have positions and effect transactions in the securities mentioned herein.


