
August 15, 2019
ISP Finance Services Limited’s (ISP), Results for the six months ended June 30, 2019, Total Interest Income amounted to $182.02 million compared to $144.13 million in 2018, an increase of 26%. For the quarter, Total Interest income amounted to $95.80 million (2018: $73.67 million). Year to date Total Interest Income is broken down as follows:
- Interest Income from Loans grew by 26% to total $182.02 million relative to $143.96 million reported in the same period of 2018.
- Interest Income Receivables drastically went down by 100% to nil (2018: $174,296).
Interest Expense totaled $15.14 million relative to $11.22 million in 2018; this represents a 35% increase. As a result, Net Interest Income grew by 26% to total $166.88 million (2018: $132.91 million). For the quarter interest expense rose by 35% to close the quarter at $7.55 million (2018: $5.59 million). Net Interest Income for the quarter increased 30% to total $88.25 million (2018: $68.08 million).
Commission Expense dipped by 22% to $1.11 million (2018: $1.42 million). Foreign Exchange Gain totaled $94,109 (2018: $70,206). Service fees was nil relative to $1.75 million for the prior year. As a result gross profit increased to $165.87 million (2018: $133.31 million), while for the gross profit for the quarter went up by 27% or $18.63 million to $87.93 million (2018: $69.30 million).
The company’s Total Operating Expense amounted to $137.23 million up from $113.78 million in 2018. The expenses are broken down as follows:
- Staff Costs amounted to $65.10 million (2018: $56.43 million)
- Allowance for Credit Loss totalled $27 million (2018: $14.94 million)
- Depreciation was $2.60 million (2018: $2.93 million)
- Other Operating Expenses amounted to $42.54 million (2018: $39.48 million)
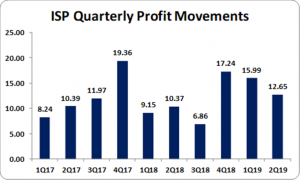
Consequently, Net Profit for the period amounted to $28.64 million relative to a profit of $19.53 million in 2018, a 47% increase year over year. However, net profit for the quarter had a increase of 22% amounting to $12.65 million (2018: $10.37 million).
The Company noted that it has “maintained its cost of operations while meeting greater customer demands. The newly established customer sales contact center is contributing to the business development thrust aggressively promoting the Company’s most recent back to school loan initiative.
As a result, EPS for the period closed at $0.27 (2018: $0.19). The EPS for the quarter was $0.12 (2017: $0.10). The 12-month trailing EPS is $0.50 and the number of shares used in our calculations is 105,000,000 units. ISP’s stock last traded on August 15, 2019 at $17.87
Balance Sheet Highlights:
As at June 30, 2019, ISP reported total assets of $652.72 million, a 24% uptick when compared to $527.79 million in the prior year. This was attributed to the increase of the company’s ‘Loans, net of provisions for credit losses’ which closed at $592.17 million (2018: $475.28 million), up $116.89 million. However, this was offset by a reduction in Other Receivables that ended the period at $12.88 million (2018: $20.94 million).
Shareholders’ Equity as at June 30, 2019 was $349.03 million compared to a $305.80 million in 2018. This resulted in a book value per share of $3.32 compared to $2.91 the prior year.
Analyst Certification -This research report is for information purposes only and should not be construed as a recommendation. Each research analyst (s) also certify that no part of their compensation was, is, or will be, directly or indirectly, related to the specific recommendation (s) or view (s) expressed by that research analyst in this research report.
Company Disclosure -The information contained herein has been obtained from sources believed to be reliable, however its accuracy and completeness cannot be guaranteed. You are hereby notified that any disclosure, copying, distribution or taking any action in reliance on the contents of this information is strictly prohibited and may be unlawful. Mayberry may effect transactions or have positions in securities mentioned herein. In addition, employees of Mayberry may have positions and effect transactions in the securities mentioned herein.


