
November 13, 2019
PANJAM Investment Limited (PJAM), for nine months ended September 30, 2019 reported a 31% increase in total income to $3.50 billion relative to $2.68 billion booked for the prior year’s corresponding period. For the quarter, total income decreased 23% to close at $1.20 billion (2018: $1.56 million). Of total income:
-
- Investment income increased 60% to close at $1.96 billion (2018: $1.22 billion). According to PJAM, “the prior year third quarter included particularly large unrealized gains relating to a significant purchase of shares at a discounted price.” The year to date performance was due to improved realized and unrealized gains and dividend income.
- Property income rose 4% to $1.43 billion compared to $1.37 billion twelve months earlier. PJAM noted, “higher rental income resulted from more space leased on average as well as contractual rate increases, while net lease income grew at a slower pace in alignment with direct expenses.”
- Other income grew 24% or $23.11 million from $95.89 million in 2018 to $119 million for the nine months ended September 30, 2019.
Operating expenses amounted to $1.27 billion for the nine months ended September 30, 2019 (2018: $1.20 billion), 6% more than its total a year prior. Operating expenses for the quarter decreased at 1% to close at $422.63 million (2018: $426.11 million).
Consequently, Operating Profits jumped by 50% to a total of $2.20 billion relative to $1.47 billion in 2018, while for the quarter, operating profit declined to $7761.67 million (2018: $1.13 billion).
Finance costs for the period rose by 16%, amounting to $520.51 million compared to the $447.35 million for the comparable period in 2018. This was attributable to, “higher average debt balances partially offset by lower interest rates.”
Gain on Disposal of associated Company amounted to $1.62 billion relative to $47.31 million for the prior year, while the Share of results of associated companies increased 18% to $3.54 billion (2018: $2.99 billion).
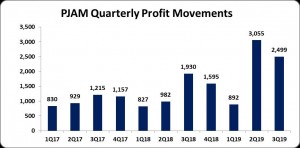
Profit before taxation increased 69% closing the period at $6.85 billion (2018: $4.06 billion). Following taxation of $386.62 million (2018: $297.99 million), Net Profit amounted to $6.46 billion (2018: $3.76 billion). Net profit for the quarter amounted to $2.50 billion relative to $1.94 billion for the corresponding quarter of 2018.
Net Profit Attributable to Shareholders for the period amounted to $6.45 billion, a 72% increase over the $3.74 billion recorded the year prior. For the third quarter, profit attributable to shareholders amounted to $2.50 billion relative to $1.93 billion.
Consequently, earnings per share for the period amounted to $6.05 (2018: $3.51), while the third quarter EPS amounted to $2.34 (2018: $1.81). The trailing twelve months earnings per share was $7.54. The number of shares used in the calculation is 1,066,159,890 units. PJAM’s stock last traded on November 13, 2019 at $101.08.
Balance Sheet at a glance:
As at September 30, 2019, PJAM had assets totaling $50.19 billion, relative to $43.53 billion a year prior. The growth was attributed to an increase in Financial assets at fair value through profit and loss of $9.02 billion (2018: $6.86 billion). Investment in associated companies also contributed to the increase in the asset base which amounted to $30.52 billion (2018: $26.13 billion).
Shareholders Equity amounted to $41.35 billion (2018: $33.08 billion) with a book value per share of $38.78 (2018: $31.02).
Disclaimer: Analyst Certification -The views expressed in this research report accurately reflect the personal views of Mayberry Investments Limited Research Department about those issuer (s) or securities as at the date of this report. Each research analyst (s) also certify that no part of their compensation was, is, or will be, directly or indirectly, related to the specific recommendation (s) or view (s) expressed by that research analyst in this research report.
Company Disclosure -The information contained herein has been obtained from sources believed to be reliable, however its accuracy and completeness cannot be guaranteed. You are hereby notified that any disclosure, copying, distribution or taking any action in reliance on the contents of this information is strictly prohibited and may be unlawful. Mayberry may effect transactions or have positions in securities mentioned herein. In addition, employees of Mayberry may have positions and effect transactions in the securities mentioned herein.


