
Date: November 14, 2019
Seprod Limited (SEP) posted revenue totalling $24.80 billion compared to $14.70 billion recorded for the same period of the prior financial year, representing a 69% increase year over year. Seprod noted, “This was driven primarily by the acquisition of the Facey Consumer Division in Q4 2018 and by an increase in the export business.” The Manufacturing Division recorded a 21% decline for the period while the Distribution Division recorded a significant increase closing at $18.07 billion (2018: $5.24 billion). For the third quarter, total revenue climbed by 69% to total $8.19 billion relative to $4.86 billion reported the prior year’s corresponding quarter.
Cost of sales increased by 61% from $9.79 billion in 2018 to $15.77 billion in 2019, resulting in gross profit increasing by 84% to close at $9.02 billion (2018: $4.91 billion). For the quarter, gross profit closed the period at $2.88 billion relative to $1.54 billion in the previous comparable period.
Other operating income totalled $175.03 million compared to $676.66 million in 2018, a 74% reduction year over year. For the quarter, other operating loss closed at $149 million versus other operating income of $451.92 million in the prior corresponding period.
Other operating expense closed the period under review at $6.99 billion (2018: $3.60 billion). However, for the quarter, other operating expenses amounted to $2.08 billion (2018: $1.35 billion).
As such, Operating Profit grew 11%, moving from $1.99 billion in 2018 to $2.21 billion to close the nine months period of 2019. For the quarter, operating profit went up 2% to total $650.89 million (2018: $639.34 million).
Finance costs totalled $866.66 million (2018: $433.98 million). For the quarter, finance cost closed at $331.80 million compared to $152.81 million in the prior comparative quarter.
Profit before taxation declined to $1.39 billion in 2019, a 12% reduction on the $1.57 billion reported a year prior. Profit before taxation for the third quarter amounted to $310.07 million (2018: $489.37 million).
Seprod reported net profit of $1.16 billion, a decline of 6% relative to last year’s corresponding period of $1.24 billion, after incurring taxes of $223.81 million (2018: $327.66 million). For the quarter, net profit declined by 33% to $284.61 million compared to $423.30 million in 2018. “The decline in profits from continuing operations was due in large part to one-off expenses (inclusive of redundancy payments) related to the consolidation of the dairy business and closure of the sugar factory during the period,” Management stated.
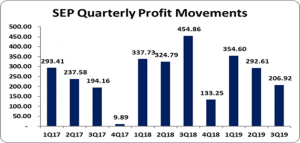
Net Profit attributable to shareholders amounted to $895.08 million, a year over year decline from the $1.13 billion recorded a year earlier. For the third quarter, Net Profit attributable to shareholders totalled $206.92 million (2018: $454.86 million).
Consequently, Earnings per share (EPS) for the nine months ended September 30, 2019 amounted to $1.22 relative to $1.54 for the corresponding period in 2018. Earnings per share for the third quarter was recorded at $0.28 (2018: $0.62). The twelve months trailing EPS is $1.30. The number of shares used in our calculation is 733,546,855. SEP last traded on November 14, 2019 at $51.74.
Seprod highlighted that, “On 15 July 2019, management executed on its previously communicated decision to close the sugar factory and, in so doing, curtail the ten (10) years of operational losses from sugar manufacturing. This move will positively impact the Group’s return on equity and its cashflows in the future. The losses from this discontinued operation for the nine (9) months ended 30 September 2019 amounted to J$455 million (J$275 million for the corresponding period in 2018).”
Balance sheet at a Glance:
As at September 30, 2019, the Company’s Total Assets increased by 48% to $34.57 billion from $23.36 billion a year ago. The growth in assets was largely due to increases in both ‘Intangible Assets’ which closed at $7.26 billion (2018: $6.69 billion) and ‘Inventories’ which closed at $5.69 billion (2018: $4.10 billion).
Shareholders’ Equity for the period ended at $15.15 billion relative to $10.76 billion last year, indicating a 41% increase. This translated into a book value per share of $20.66 (2018: $14.66).
Disclaimer: Analyst Certification -The views expressed in this research report accurately reflect the personal views of Mayberry Investments Limited Research Department about those issuer (s) or securities as at the date of this report. Each research analyst (s) also certify that no part of their compensation was, is, or will be, directly or indirectly, related to the specific recommendation (s) or view (s) expressed by that research analyst in this research report.
Company Disclosure -The information contained herein has been obtained from sources believed to be reliable, however its accuracy and completeness cannot be guaranteed. You are hereby notified that any disclosure, copying, distribution or taking any action in reliance on the contents of this information is strictly prohibited and may be unlawful. Mayberry may effect transactions or have positions in securities mentioned herein. In addition, employees of Mayberry may have positions and effect transactions in the securities mentioned herein.


