May 13, 2025
First Rock Real Estate Investments Limited (FIRSTROCKJMD)
Unaudited Financials for the First Quarter Ended March 31, 2025
Expressed in United States dollars except where otherwise stated
First Rock Real Estate Investments Limited (FIRSTROCKJMD) reported a 15% increase in property income, totaling US$1.86 million, compared to US$1.63 million for the corresponding three months in 2024.
Rental income amounted to US$295,179 (2024: US$16,204), representing a 1,722% year-over-year increase. Consequently, realised and unrealised gains on investment properties rose by 336% to US$1.57 million, compared to US$359,961 for Q1 2024.
Interest income from financial assets at amortised cost decreased by 68%, closing at US$29,747 (2024: US$93,792), while interest expense increased by 98%, rising from US$230,610 in 2024 to US$457,471 for the quarter under review. As a result, Net Operating Income for Q1 2025 amounted to US$1.28 million, a 36% decrease compared to US$1.99 million in 2024.
Total expenses for the three months amounted to US$733,727, a 69% decrease from US$2.41 million in 2024. Operating profit totaled US$545,611, a 233% increase from the corresponding period last year (2024: Operating loss of US$410,457).
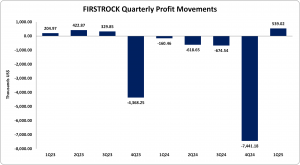
Net profit for the quarter increased by 436%, reaching US$539,023 (2024: Net loss from continuing operations of US$160,457).
As a result, Earnings Per Share (EPS) for the quarter amounted to US$0.002 (2024: Loss Per Share (LPS): US$0.001). The twelve-month trailing LPS was US$0.03, based on 38,253,000 shares used in the calculation. Notably, FIRSTROCKJMD’s stock price closed the trading period on May 12, 2025, at J$9.60.
Balance Sheet Highlights
The company’s assets totalled US$59.59 million (2024: US$57.52 million). This increase was primarily by investment property which equated to $33.02 million (2024: US$14.22 million)
Shareholders’ equity was US$26.21 million (2024: US$34.40 million), representing a book value per share of US$0.09 (2024: US$0.12).
Disclaimer:
Analyst Certification – The views expressed in this research report accurately reflect the personal views of Mayberry Investments Limited Research Department about those issuer (s) or securities as at the date of this report. Each research analyst (s) also certify that no part of their compensation was, is, or will be, directly or indirectly, related to the specific recommendation (s) or view (s) expressed by that research analyst in this research report.
Company Disclosure – The information contained herein has been obtained from sources believed to be reliable, however its accuracy and completeness cannot be guaranteed. You are hereby notified that any disclosure, copying, distribution or taking any action in reliance on the contents of this information is strictly prohibited and may be unlawful. Mayberry may affect transactions or have positions in securities mentioned herein. In addition, employees of Mayberry may have positions and effect transactions in the securities mentioned herein.