
May 9, 2018
Interest income declined by 5% during the six month period, amounting to $511.74 million relative to $540.44 million for the comparable period in 2017. Interest expense also declined to close at $322.43 million compared to $394.49 million in 2017. As a result, net interest income increased by 30% to $189.31 million relative to $145.95 million in 2016. As a result, Net Interest Income for the period posted a 30% improvement to $189.31 million relative to $145.95 million reported for the corresponding period in 2016. Net Interest Income for the quarter was $108.53 million, up 57.80% from $68.80 million in 2017.
Dividend Income dipped by 61% to total $5.12 million compared to the $13.04 million earned for the six months ended March 31, 2017. Gains on sale of investment also declined by 35% to $81.09 $million (2017: $124.14 million). Income from Fees & Commissions rose by 8% to close at $239.90 million (2017: $222.52 million).
BIL reported Foreign exchange trading and translation losses of $25.91 million for the period, compared to $20.64 million gain recorded in the previous year.
Administrative Expenses for the period amounted to $199.92million, increasing 11% from $179.45 million in 2017. Staff costs fell 2% to total $170.57 million (2017: $174.65million). Notably, BIL reported no Impairment of available-for-sale investment for the reported period (2017: $40 million). As such, total expenses for the period fell 6% to close at $370.49 million (2017: $394.10 million).
Profit before Taxation, however, deteriorated by 11% to $119.61 million compared to $133.82 million the prior year.
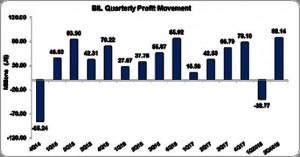
Consequently, the company reported Net Profit of $49.37 million, a 15% decrease relative to the $58.13 million booked in 2017; this followed taxation of $ 70.24million (2017: $75.7 million). While Net Profit for the second quarter was $88.14million up 107.20% from last year’s corresponding period of $42.53 million.
Earnings per Share for the second quarter ended March 31, 2018 totalled $0.20 relative to $0.10 in 2017. The EPS for the six month period amounted to $0.11, down $0.02 from $0.13 recorded for the comparable period in 2017. The trailing earnings per share amounted to $0.44, while the stock traded at $10.50 on May 8, 2018. The number of shares used in our calculations amounted to 445,001,824 units.
Balance Sheet at a glance:
As at March 31, 2018, total assets amounted $16.13billion (2017: $15.97 billion), an $162.89 million improvement mainly due to a growth in ‘Pledged Assets’ which increased by 21% to a total of $8.02 billion (2017: $6.62 billion). Tempering the overall growth in assets was the marketable securities which fell 38% to close at $2.60 billion (2017: $4.19 billion).
Shareholders’ Equity amounted to $2.85 billion relative to $2.86 billion in 2017 resulting in a book value per share of $6.41relative to $5.15 in 2017.
Disclaimer:
Analyst Certification -The views expressed in this research report accurately reflect the personal views of Mayberry Investments Limited Research Department about those issuer (s) or securities as at the date of this report. Each research analyst (s) also certify that no part of their compensation was, is, or will be, directly or indirectly, related to the specific recommendation (s) or view (s) expressed by that research analyst in this research report.
Company Disclosure -The information contained herein has been obtained from sources believed to be reliable, however its accuracy and completeness cannot be guaranteed. You are hereby notified that any disclosure, copying, distribution or taking any action in reliance on the contents of this information is strictly prohibited and may be unlawful. Mayberry may effect transactions or have positions in securities mentioned herein. In addition, employees of Mayberry may have positions and effect transactions in the securities mentioned herein.


